Quarter 4 Performance Report
Summary
Agency board report number: SEPA 22/23 - May 2023
This report provides an assessment of our performance against the ten measures set out in our Annual Operating Plan 2022-2023.
The Board has received quarterly performance reports. This final report summarises performance over the whole year. Each measure has been assessed as either ‘achieved’ or ‘not achieved’.
- We have achieved eight of the performance measures.
- We are now determining applications for licences more quickly than we did last year.
- We have reviewed and modified most of the authorisations in our plan.
- We have significantly increased our monitoring.
- We have improved compliance at 21 prioritised non-compliant sites and concluded investigation and enforcement action at 11 priority illegal sites.
- Our registration system to support the Deposit Return Scheme was in place on 1 January 2023.
- Our new flood warning information system is operational.
- We issued warnings and alerts for all significant flooding events.
- We also launched the new Carron flood warning scheme which will benefit over 1500 properties and businesses.
We did not achieve two performance measures:
Despite a strong focus on positive health and workplace wellbeing, health and well-being levels among staff have not improved. The pulse survey results we have been reporting do not give us the information we need to judge how well the support we have put in place, and continue to develop, fully meets staff needs.
Greenhouse gas emissions have not reduced. Although we do not have the full year’s data yet, we predict that emissions this year will have increased compared with the previous two years.
Staff updates are noted under Measure 9: Health and wellbeing levels among staff have improved from the average levels in 2021-2022 pulse surveys.
No equality issues have been highlighted in this report.
Updates relating to our environmental impact are noted under Measure 10: Reduction in our direct greenhouse gas emissions by 70% from our 2006-2007 baseline.
The report is for the Board to note. It will be published on our website. The information in this report will be included in our 2022-2023 Annual Report and Accounts.
- Bridget Marshall, Acting Chief Officer, Performance and Innovation
- Craig Ballantyne, Junior Business Consultant
- Anne Turner, Business Strategy Manager
Executive Summary
We set out ten performance measures in our Annual Operating Plan in 2022 to drive delivery and help us assess our progress through the year. We achieved eight of the measures. In this report we explain our performance over the whole year. We have divided the report into three sections: regulation and flooding are our two key services; organisation describes our internal performance.
Regulation
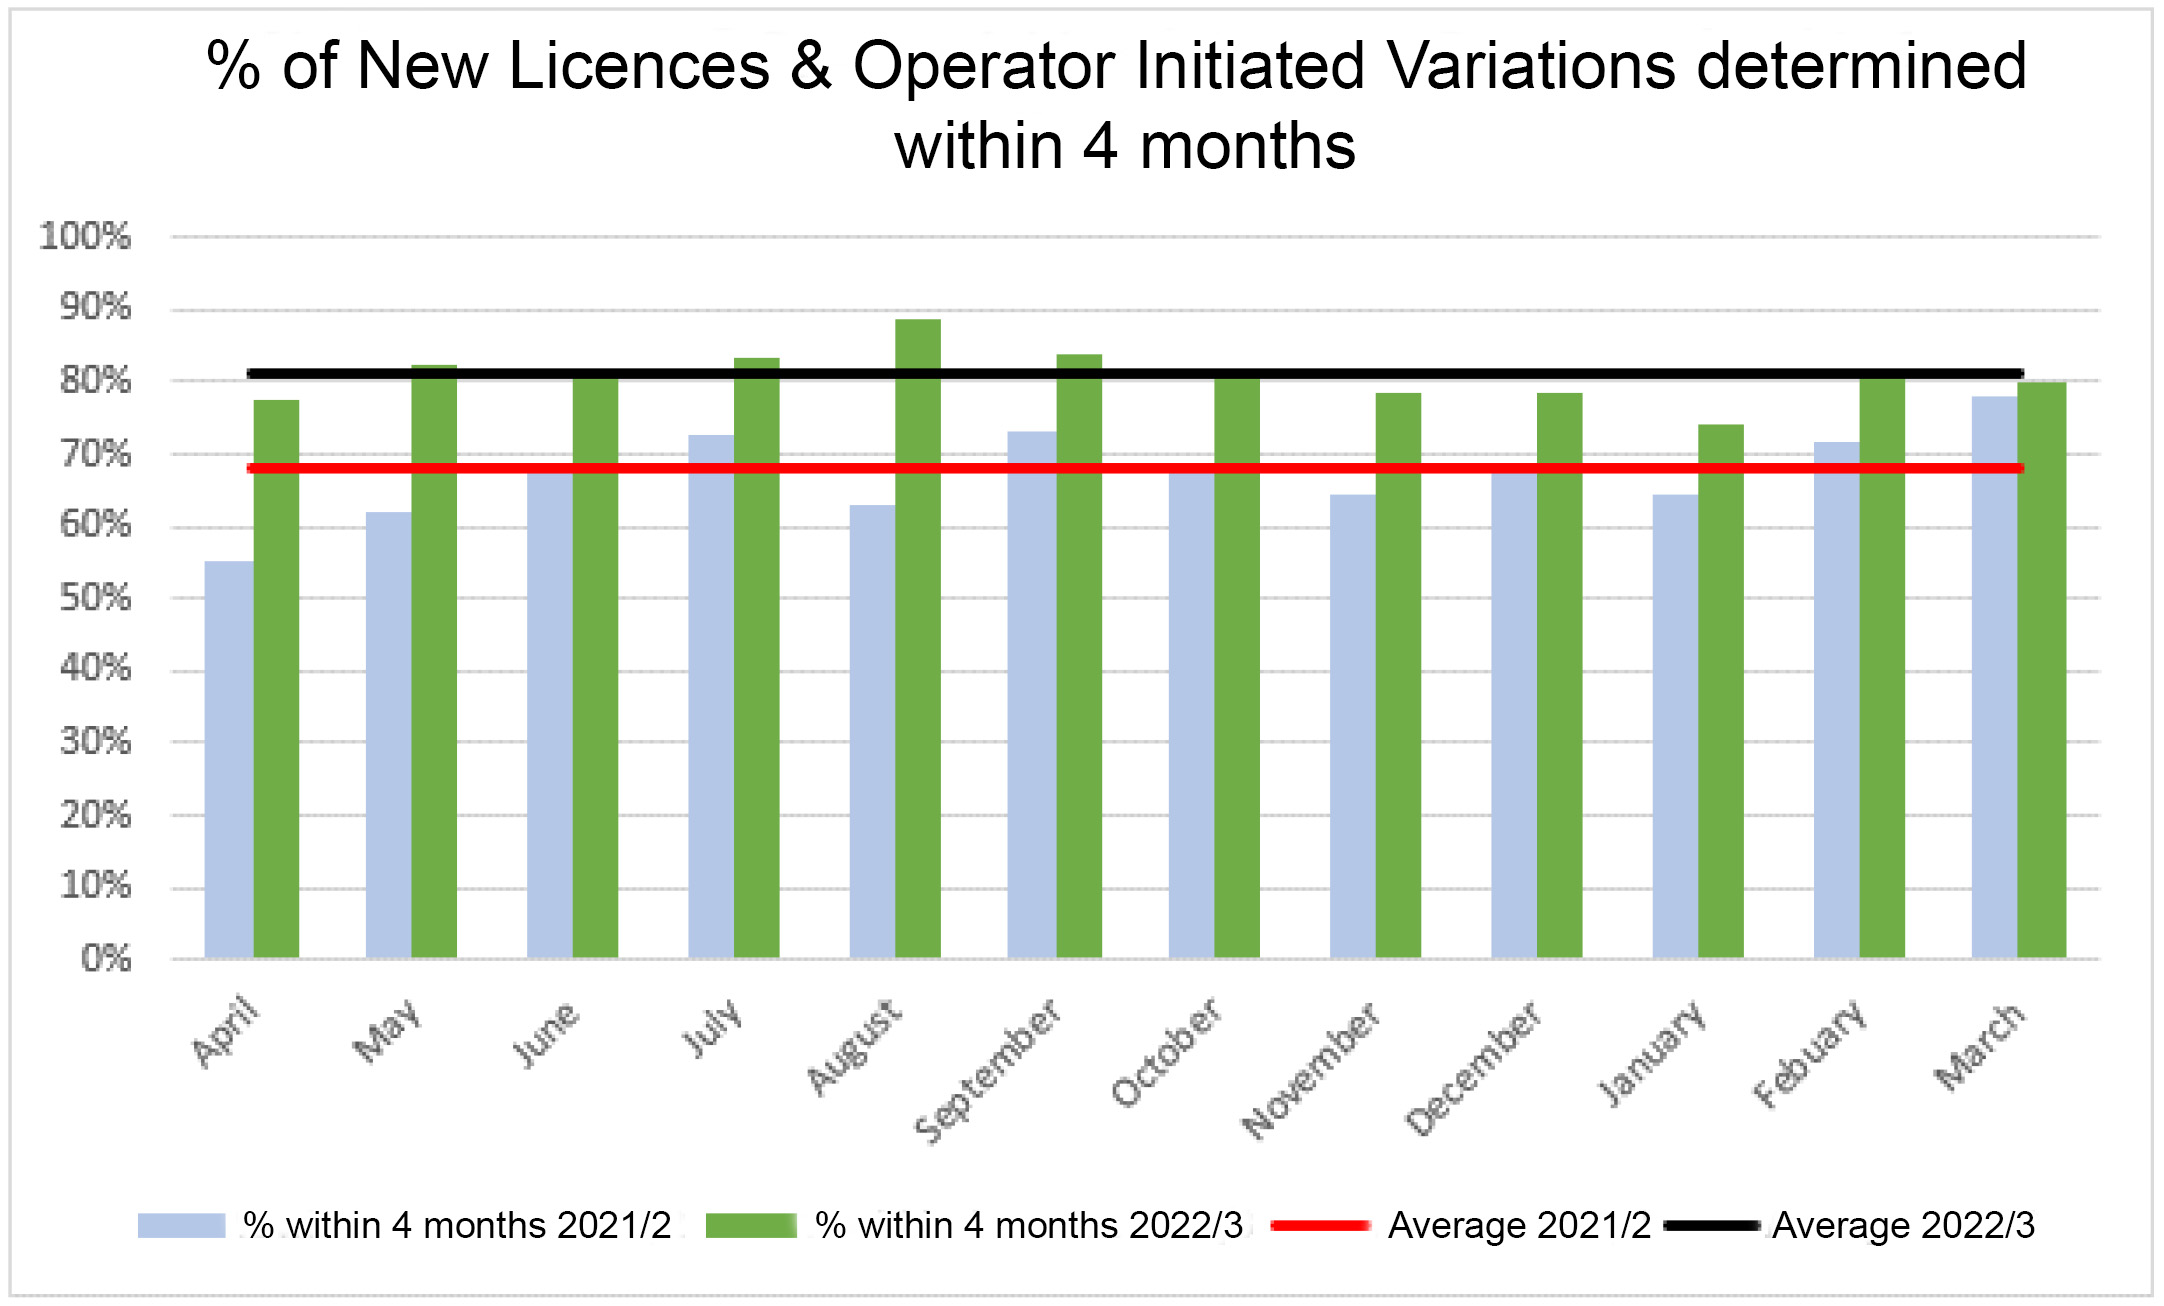
We regulate activities which can harm the environment. Businesses which carry out these activities can apply to us for authorisation. This year we wanted our staff to continue to focus on improving our authorisation systems and processes, but we did not want that to increase the time it takes us to determine requests for authorisations. We also wanted to review specific authorisations and, where necessary,revise the conditions set in them so that they will provide better environmental protection. Our target was to complete our review plans for seven out of the nine planned activities. We achieved both goals, and exceeded the first, managing to reduce the time it takes us to determine authorisations. The average percentage of authorisations we determined within statutory timescales increased from 68% in 2021 to 81% in 2022. We successfully reviewed and modified authorisations for eight of the nine activities set out in our plans. For the ninth activity, which was waste treatment licences, we encountered several issues but completed 84% of the planned licence reviews. The remainder will be complete by the end of September.
Once businesses have an authorisation, we check that they are meeting the conditions we have set. We also investigate sites where activities are being carried out without the appropriate authorisation. We use an intelligence-led approach to identify priority sites and activities to focus on. We have been monitoring our performance in this area to check that our actions are leading to an improvement in compliance at the sites we have prioritised and that we are eliminating unlicensed activities. During the reporting year we have concluded investigation and enforcement at 11 priority illegal sites and improved compliance at 21 priority authorised sites.
We monitor water, land, and air quality to enable effective decision making, help communities understand the environment and the opportunities it offers, and ensure that we understand the impacts that regulated businesses are having on the environment. This year we reported our progress rebuilding our environmental monitoring capacity following COVID-19 restrictions and the cyber-attack. We successfully expanded the range of monitoring activities we carry out and the extent of some of our key monitoring activities. This included monitoring to assess the environmental impact of 15 high priority wastewater treatment sites; monitoring to assess the effectiveness of River Basin Management Planning improvement measures, long-term water quality monitoring and monitoring at three additional beaches. Our bathing water monitoring showed that Scotland’s bathing water quality continues to improve with 38 out of 87 (44%) bathing waters rated as ‘excellent’ for 2023.
We will be the regulator for Scotland’s new deposit return scheme. We reported our performance implementing a registration system through the year because we wanted to make sure we were ready to register producers by 1 January 2023. We achieved our goal. The digital registration service was live on 1 January and has performed well with no interruption to service since launch. We also have a paper-based registration service available for those who are not able to access the digital service and to ensure business continuity.
Flooding
Our flood warning service helps Scottish communities, businesses and civil contingency responders to take action to reduce the impact of flooding. We measure our performance to ensure that our flood warning service is effective. This year we achieved our goal, issuing warnings and alerts in time for the five significant flood events.
We have a project underway to transform the flood messaging service we provide to our customers, and to expand its use to cover other hazards, like water scarcity. This year we have reported the progress of this project each quarter. We have achieved this measure, ensuring that the service was operational and delivering new features such as the integration of flood warning messages to our ‘SEPAFlood’ Twitter channel and the formal launch of the Scottish Flood Forecast.
Our flood warning schemes deliver advance warnings of floods to targeted local areas. This year we aimed to expand our service by developing a new flood warning scheme for the River Carron in Falkirk. We monitored our progress with this project through the year. The scheme, which includes six new Flood Warning Areas, is now live and will benefit over 1500 properties and businesses.
Organisation
The two measures that were set for improving our internal performance were ambitious, reflecting the importance we place on our staff and on being an exemplar in reducing our carbon impact. Unfortunately, we have not achieved either of the measures during this financial year. Staff wellbeing has been and will continue to be a priority for SEPA. Over the last year we used pulse surveys to ask staff to rate their wellbeing. Our target was to see an increase in wellbeing levels reported via these pulse surveys, from the baseline levels set in March 2022. Despite having a range of support in place to help with wellbeing, and implementing other initiatives to support physical health and wellbeing over the year, the survey results indicate that wellbeing levels have not improved.
Although our survey results are broadly in line with national trends, we now recognise that gathering feedback through pulse surveys did not give us enough insight to inform where we could make a difference for our staff. Moving forward, we will continue to listen to our staff, but will seek feedback in a variety of different ways, including through a more extensive staff survey planned for June 2023. We have learned a lot and are adapting our approach. We retain a strong focus on positive health and workplace wellbeing which remains embedded in our work programme for this year.
Our goal is to become a regenerative organisation. This means tackling the direct and indirect environmental impacts we have by reducing them to net zero wherever possible. At the same time, we will take opportunities to be net positive through actions that restore the environment. We have reduced our direct greenhouse gas emissions by almost two thirds in the last decade and hoped to increase that this year to a 70% reduction from our 2006-2007 baseline. We did not achieve that goal. Based on Quarter 1, 2, and 3 trends we predict that when we have figures for the whole year, we will have reduced emissions by around 57% compared to our baseline. This is well below our 70% target and would represent a significant rise in emissions, of around 38%, compared to the previous two years. There are two main reasons for this. Firstly, we have progressively opened more offices over the year and emissions from our buildings have increased accordingly. Despite this, most staff continue to work from home. This means we now have two significant sources of buildings emissions where previously we only had one. Secondly, emissions associated with travel have increased this year compared with the previous two years which were impacted by the COVID-19 pandemic.
Performance dashboard
| Performance measure | RAG | |
|---|---|---|
| Regulation | ||
| 1 | No deterioration in the length of time it takes to determine licences | Achieved |
| 2 | Our plans to review and modify authorisations are on track | Achieved |
| 3 | We have significantly increased monitoring to improve our understanding of the effect of regulation on the environment | Achieved |
| 4 | An improvement in compliance at prioritised, non-compliant sites | Achieved |
| 5 | We have implemented a registration system to support the Deposit Return Scheme by 1 January 2023 | Achieved |
| Flooding | ||
| 6 | Warnings and alerts issued for all significant flooding events | Achieved |
| 7 | Our new flood warning information system is operational | Achieved |
| 8 | We have launched the new Carron flood warning scheme | Achieved |
| Organisation | ||
| 9 | Health and well-being levels among staff have improved from the average levels in 2021-2022 pulse surveys | Not achieved |
| 10 | Reduction in our direct greenhouse gas emissions by 70% from our 2006-2007 baseline | Not achieved |
This performance report explains progress with the ten measures set out in our Annual Operating Plan 2022-2023. It is intended to be informative and easy to follow. As this is the final report of the year, we assess measures as being either Achieved (Green) or not Achieved (Red). We do not have any Amber ratings.
Find out more detailed descriptions of each of our performance measures.
RAG status traffic light codes
- Achieved - Measure was achieved
- Not Achieved - Measure was not achieved
Performance updates
Regulation
Measure 1: No deterioration in the length of time it takes to determine licences
- CLT leads: Lin Bunten & David Harley
- Achieved
We achieved this measure. Businesses which carry out activities that could harm the environment can apply to us for authorisation. This year we wanted our staff to continue improving our authorisation systems and processes, while still maintaining a good level of service for our customers. We exceeded our goal, because we were able to improve the level of service for our customers.
View the graph that shows there has been a consistent improvement in the number of new licences and variations that have been determined within four months of the application.
The graph includes the issue of permits and variations under the following regulations:
- Water Environment (Controlled Activities) (Scotland) Regulations 2011- Controlled Activity Regulations (CAR)
- Pollution Prevention and Control (Scotland) Regulations 2012 (PPC 2012) - Part A & Part B
- Waste management licences under the Environmental Protection Act 1990 and Waste Management (Scotland) Regulations 2011
- Environmental Authorisations (Scotland) Regulations (EASR) for Radioactive substances.
Measure 2: Our plans to review and modify authorisations are on track
- CLT lead: Lin Bunten
- Achieved
We achieved this measure. This year we wanted to review a number of authorisations and revise the conditions set in them so that they provide better environmental protection. The authorisations we focused on related to: the review of industrial activities Best Available Techniques reference documents (also referred to as BREF); the River Basin Management Plan; and our new regulatory framework for marine pen fish farms.
Over the year, we have made progress on activities in each of these areas. Our end of year target was to have reviewed and modified authorisations in seven out of the nine planned activities. We exceeded that by completing the work for eight activities.
| Area | Activity | RAG Status |
|---|---|---|
| Best Available Techniques Reference Documents Review | Intensive Rearing of Poultry or Pigs | Achieved |
| Large Volume Organic Chemicals | Achieved | |
| Large Combustion Plants | Achieved | |
| Waste Treatment | Not Achieved | |
| River Basin Management Plan 2021-2027 | Hydroelectric Licences | Achieved |
| Fish Barriers | Achieved | |
| Discharge Authorisations | Achieved | |
| Scottish Water Abstraction authorisations | Achieved | |
| Marine pen fish farms | Marine pen fish farms | Achieved |
Best Available Techniques reference documents review
We completed authorisation reviews for the three activity areas of Intensive Rearing of Poultry and Pigs, Large Volume Organic Chemicals and Large Combustion Plants by the deadline of 31 August 2022.
By 31 March 2023, we had completed reviews for 86% (46 of the 55) Waste Treatment permits, although the permit variations are still to be finalised and issued. We have agreed with the Scottish Government that these will be completed by the end of September 2023.
This work is behind schedule for a variety of reasons including out of date permits, changes in permitted site activities, difficulties with the application of the Best Available Technique conclusions relating to indirect (sewer) discharges, workload and an unexpected resourcing issue. Ongoing technical and specialist support remains in place and we have secured additional resource to assist with the peer reviews, formatting and issuing of the permits.
River Basin Management Plan
We reviewed 13 hydro licences in water bodies at poor and bad status. We reviewed all 18 fish barrier structures which were identified as potential obstacles to fish movement. Six of the barriers required the licence to be varied and this has been done, allowing five barriers to be removed or eased, leading to increased fish movement to upper catchments. The remaining one will be completed in 2023. For Scottish Water abstraction authorisations, we completed measures on six water bodies and delivered environmental improvements.
While we completed the planned work to vary the Scottish Water discharge authorisations, in October they applied for a “disproportionate cost” exemption at each discharge. This additional, unplanned work was not completed by April 2023.
Marine pen fish farms reviews
When we introduced a new regulatory framework for marine pen fish farms in June 2019, we developed a new outcome focused permit that is easier for the operators to understand, while maintaining robust controls. We have continued to update and refine the permit template and the latest version was finalised in December 2022.
We have advised all operators on how to apply to vary sites onto the new permit template. In December, we received the first set of applications covering all the sites operated by one finfish producer and we expect to issue the draft new permits in April. This has enabled us to refine the process for the other applications. Currently three other producers have provided the information for us to progress these applications. All the other licence holders have been contacted and we await their response.
Measure 3: We have significantly increased monitoring to improve our understanding of the effect of regulation on the environment
- CLT lead: David Pirie
- Achieved
We have achieved this measure by implementing our plans to increase our monitoring activities, making steady progress in most areas. Although still reduced from pre-covid levels, we are carrying out targeted monitoring, prioritised to support regulation. Our increases in environmental monitoring have been balanced with the need to increase our monitoring of licensed discharges to surface waters as part of our compliance verification work.
Bathing Waters: We successfully completed the Bathing Waters monitoring programme. As well as an increase in sampling frequency at sites in the upstream catchments, we monitored two more bathing beaches (Largo and Barassie) and one additional non-bathing water beach (Wardie). That meant that we classified the highest number ever of bathing water beaches (87). Our monitoring highlighted sustained improvements in bathing water quality, achieved through partnership projects. Thirty-eight out of eighty-seven beaches (44%) were rated as ‘excellent.’ Overall bathing water quality has seen ongoing improvements since 2015, when tighter standards first came into force.
Long-term water quality monitoring: We completed the Spring and autumn sampling for ecology as planned. We implemented our chemistry sampling programme as planned and will provide monitoring data for the full year in 2023.
Monitoring to assess the effectiveness of River Basin Management Planning improvement measures: We completed our spring, summer and autumn sampling for ecology as planned. We also completed the implementation of the long-term water quality monitoring programme. We are making good progress with our chemistry monitoring despite challenges with scheduling and sample management.
Monitoring to assess the environmental impact of high priority wastewater treatment sites: We have instigated a monitoring plan at 15 high risk wastewater treatment sites. We completed our spring, summer and autumn ecology monitoring as planned.
Having lost the system which managed the scheduling, analysis, and reporting of samples, we continue to use interim solutions to manage samples. The interim solutions require multiple manual interventions to schedule samples, produce and share survey sheets and labels, quality assure, extract and report the data. This creates challenges and has meant that the implementation of some aspects of our surface water and groundwater chemical monitoring programmes are slower than anticipated. We have taken steps to improve overall project management in this area to support delivery. Work is underway to develop a long-term solution for our laboratory management system, which should be live by the end of this financial year
Measure 4: An improvement in compliance at prioritised, non-compliant sites
- CLT leads: Lin Bunten and David Harley
- Achieved
We have achieved this measure, bringing about improvements in compliance in both authorised and illegal sites.
Improving compliance at high priority illegal sites
At the start of the year, we were monitoring 296 illegal sites. We categorised 53 of them as high priority, which means they are at the most significant end of the scale of impact to the environment or communities and criminality. They include activities like the large-scale, co-ordinated treatment, deposit or disposal of waste, discharge to the water environment and multiple end-of-life vehicle treatment sites. For these sites, successful intervention often relies on multi-agency disruption and intervention work coupled with criminal investigation. Civil penalty measures are rarely an appropriate tool for use in these circumstances and each intervention is planned on a case specific basis. These interventions generate significant resource demands.
We started the year with 53 prioritised illegal sites. We have concluded investigation and enforcement action at nine of them. Enforcement action included:
- provision of advice which resulted in the illegal activity ceasing;
- remediation through negotiation which resulted in site clearance;
- partnership working with the Local Authority’s Planning Department which resulted in compliant waste removal and site clearance;
- partnership working including road stops to disrupt localised fly tipping & duty of care checks to prevent use of illegal sites;
- a report to Crown Office and Procurator Fiscal Service;
- and the issue of final warning letters.
Following investigation and assessment of risk and harm, we were able to downgrade two sites which were previously high risk.
Over the year we identified an additional 14 priority illegal sites. We have also concluded investigation and enforcement action at two of these. At the end of the year, we have 54 prioritised illegal sites.
| Priority illegal sites | Apr | May | Jun | Jul | Aug | Sept | Oct | Nov | Dec | Jan | Feb | Mar |
|---|---|---|---|---|---|---|---|---|---|---|---|---|
| Number of priority sites at start of month | 53 | 49 | 55 | 55 | 55 | 55 | 56 | 55 | 55 | 54 | 53 | 54 |
| New sites added | 1 | 6 | 2 | 1 | 0 | 2 | 0 | 0 | 1 | 0 | 1 | 0 |
| Impact or risk reduced or resolved during month | 5 | 0 | 2 | 0 | 0 | 1 | 1 | 0 | 1 | 1 | 0 | 0 |
| Sites downgraded after investigation | 0 | 0 | 0 | 1 | 0 | 0 | 0 | 0 | 1 | 0 | 0 | 0 |
| Number of priority sites at end of month | 59 | 55 | 55 | 55 | 55 | 56 | 55 | 55 | 54 | 53 | 54 | 54 |
Improving compliance at priority authorised sites
Priority authorised sites are those which present the most significant impacts or risk to the environment or communities. It may take a few years for the issues at priority sites to be resolved and significant investment might be needed. This year priority sites covered a range of sectors including landfill and waste management, waste-water treatment, fish farming, construction and chemical manufacturing. For successful intervention, we often rely on the use of our formal enforcement powers and take action to successfully remove or reduce the impact or risk.
We started the year with 18 priority sites and identified a further 31 during the year. The impact or risk has reduced at 21 of them over the year. To achieve this we have varied permits to apply tighter controls, served enforcement notices to require corrective actions to be taken within a specific timescale, or to suspend authorised activities until a non-compliance is addressed. In addition, we served our first Variable Monetary Penalty in October 2022 in relation to permit breaches during the previous business year.
At the end of the year, we have 29 priority authorised sites. Through increasing our compliance activity this year, we have improved our compliance information. We have also taken steps to improve our interim systems which has improved the information we hold.
| Priority authorised sites baseline | Q1 | Q2 | Q3 | Q4 |
|---|---|---|---|---|
| Number of priority sites at start of quarter | 18 | 18 | 21 | 25 |
| New sites added | 0 | 6 | 10 | 16 |
| Impact or risk reduced or resolved during quarter | 0 | 3 | 6 | 12 |
| Number of priority sites at end of the quarter | 18 | 21 | 25 | 29 |
Measure 5: We have implemented a registration system to support the Deposit Return Scheme by 1 January 2023
- CLT lead: David Harley
- Achieved
We have achieved this measure. The digital registration service was live by 1 January 2023 and has performed well with no interruption to service since launch. We also have a contingency paper-based registration service available, to support equality and accessibility considerations and ensure business continuity.
This service allows producers to register directly with SEPA. It also supports the flow of producer registrations received through Circularity Scotland, the Scheme Administrator, for final SEPA approval. Data Protection Impact Assessments and a Data Sharing Agreement were completed to ensure the safe, secure management of Deposit Return Scheme data and information.
We have completed work to build a producer register and this will be published before the scheme goes live.
We have published guidance for producers on our website. This includes helping producers determine whether their drinks are in the scope of the scheme, routes to register, and how to write an operational plan if they choose to register directly with us. We launched a targeted communications campaign encouraging producers to act in January.
Flooding
Measure 6: Warnings and alerts issued for all significant flooding events
- CLT lead: David Pirie
- Achieved
We have met this target as we issued flood alerts and warnings ahead of all significant events. Our flood warning service covers the whole of Scotland. This includes 19 regional flood alert areas and 326 locations where customers can receive more specific flood warnings.
There were five significant events this year:
- Two in Quarter 2: 14-15 August and 8 September
- Two in Quarter 3: 18-19 November and 30 December
- One in Quarter 4: 20-24 March
Quarter 2
In August, localised surface water flooding affected the transport network and communities across Scotland. It was particularly severe on 14 and 15 August. The risk was flagged yellow in the daily Flood Guidance Statement and regional flood alerts were in force.
On 8 September, a band of heavy rain affected Fife and Perthshire. Areas around Perth experienced surface water and small watercourses flooding. Several households were severely impacted, and local roads and railways lines were closed. The risk was flagged as yellow in our daily Flood Guidance Statement. Regional flood alerts across southern, central, and eastern Scotland were in force. Around 70 mm of rain was recorded in six hours at one of our local rain gauges.
Quarter 3
The East of Scotland was affected by severe flooding on 18 and 19 November. In the North-East, the event was the most severe flood since Storm Frank in December 2015 with record river flows along the River Dee and the River Don in Aberdeenshire and the South Esk in Angus. There were also impacts on communities and the transport network across the Lothian, Fife, Tayside, Aberdeenshire and Angus. This unfortunately included a tragic incident reported along the River Don. The risk was elevated to red in Aberdeenshire and we issued seven severe flood warnings on 18 November. Across the North-East, we received reports of a number of properties that suffered flooding including around six properties in Ballater and 10 properties in Kintore where we had issued severe flood warnings.
A second significant event was experienced on 30 December affecting South and Central Scotland, with the risk elevated to red along the River Nith. We issued a severe flood warning in Whitesands in Dumfries. The River Nith reached its highest level over a 40-year period of record and communities and the transport network experienced widespread flooding impacts.
Quarter 4
There was one significant event between 20-24 March during a period of high spring tides coinciding with sea surge and strong winds. The risk was elevated to yellow and we issued 10 regional flood alerts and 47 local flood warnings. Communities along the Western Isles, Orkney, Moray and Solway coasts were affected with many road and causeway closures, and localised coastal flooding.
Flood Guidance Statements - full year
All daily Flood Guidance Statements were issued on time. These highlighted:
- 300 days all Green
- 61 days: Risk elevated to yellow on at least one of the 5 days ahead
- 2 days: Risk elevated to amber on at least one of the 5 days ahead
- 2 days: Risk elevated to red on at least one of the 5 days ahead.
We issued a total of 238 regional flood alerts, 330 local flood warnings and 8 local severe flood warnings (1523 messages in total including initial, updates and ‘No Longer In Force’) during the whole year.
Our services continue to operate with interim emergency systems, which have performed well over the year. We continue to rebuild long term resilient telemetry, hydrometry archive and flood forecasting systems, and this work will continue in 2023-2024.
Measure 7: Our new flood warning information system is operational
- CLT lead: David Pirie
- Achieved
We achieved this measure. Our new flood warning information system was operational by 31 March 2023, ensuring continuity of our Floodline and associated services when the existing contract with BT ended. We also made a number of changes to the system to improve our customers’ experience.
Following a tendering process, the new contract was awarded to BT, which meant there was no disruption to the service.
We have delivered new features such as the integration of flood warning messages to our ‘SEPAFlood’ Twitter channel. This went live in February alongside the formal launch of the Scottish Flood Forecast. The Scottish Government’s recent Technology Assurance Framework health check gave positive feedback for a project of this scope.
A number of planned improvements to the Floodline service have been delayed. These include the automation of flood warnings, changes to our Business Continuity Messaging service, and a new customer account registration page. These are taking more time as, following an audit of the project by the Scottish Government, we are undertaking further accessibility testing for the improvements. They are now planned to go live in June or July. A Water Scarcity alert will also be added to the service; this is currently in the testing phase.
Measure 8: We have launched the new Carron flood warning scheme
- CLT lead: David Pirie
- Achieved
We achieved this measure as the Carron flood warning scheme is now live. It will be marketed and officially launched to the public around September 2023 to encourage people to sign up ahead of winter.
The scheme includes six new Flood Warning Areas and will benefit over 1500 properties and businesses. This includes 66 which were part of the existing Grangemouth (coastal) Flood Warning Area which will be transferred to the Carronshore Flood Warning Area. This means they will benefit from improved forecasting with the integration of tidal and fluvial interactions in the new Carron model.
The new forecasting model successfully highlighted when the water in the river Carron reached the top of its banks in Carronshore on 23 March during a period of high spring tide and surge. Fortunately, the levels remained below flood warning thresholds.
We trained duty officers on the use of the new model in March.
Organisation
Measure 9: Health and wellbeing levels among staff have improved from the average levels in 2021-2022 pulse surveys
- CLT lead: Jennifer Russell
- Not achieved
We did not achieve this measure. We put it in place because staff wellbeing is a priority for us. Low mood and poor wellbeing can result in illness, anxiety, stress, time off work and reduced performance within the workplace. We want staff to feel supported and to thrive at SEPA.
We already had a range of support in place to help with wellbeing. This year we implemented a range of other initiatives to support health and wellbeing. This included training and development, an enhanced Employee Assistance Programme, initiatives to help staff cope with the increased cost of living and improved information and signposting to additional support. We recognise that it takes time for new initiatives to become embedded and to make a difference.
Over the year we used pulse surveys to ask staff to rate their wellbeing. Our target was to see an increase in reported wellbeing levels, from the baseline levels set the previous year. The participation rate for the surveys averaged 36% of staff.
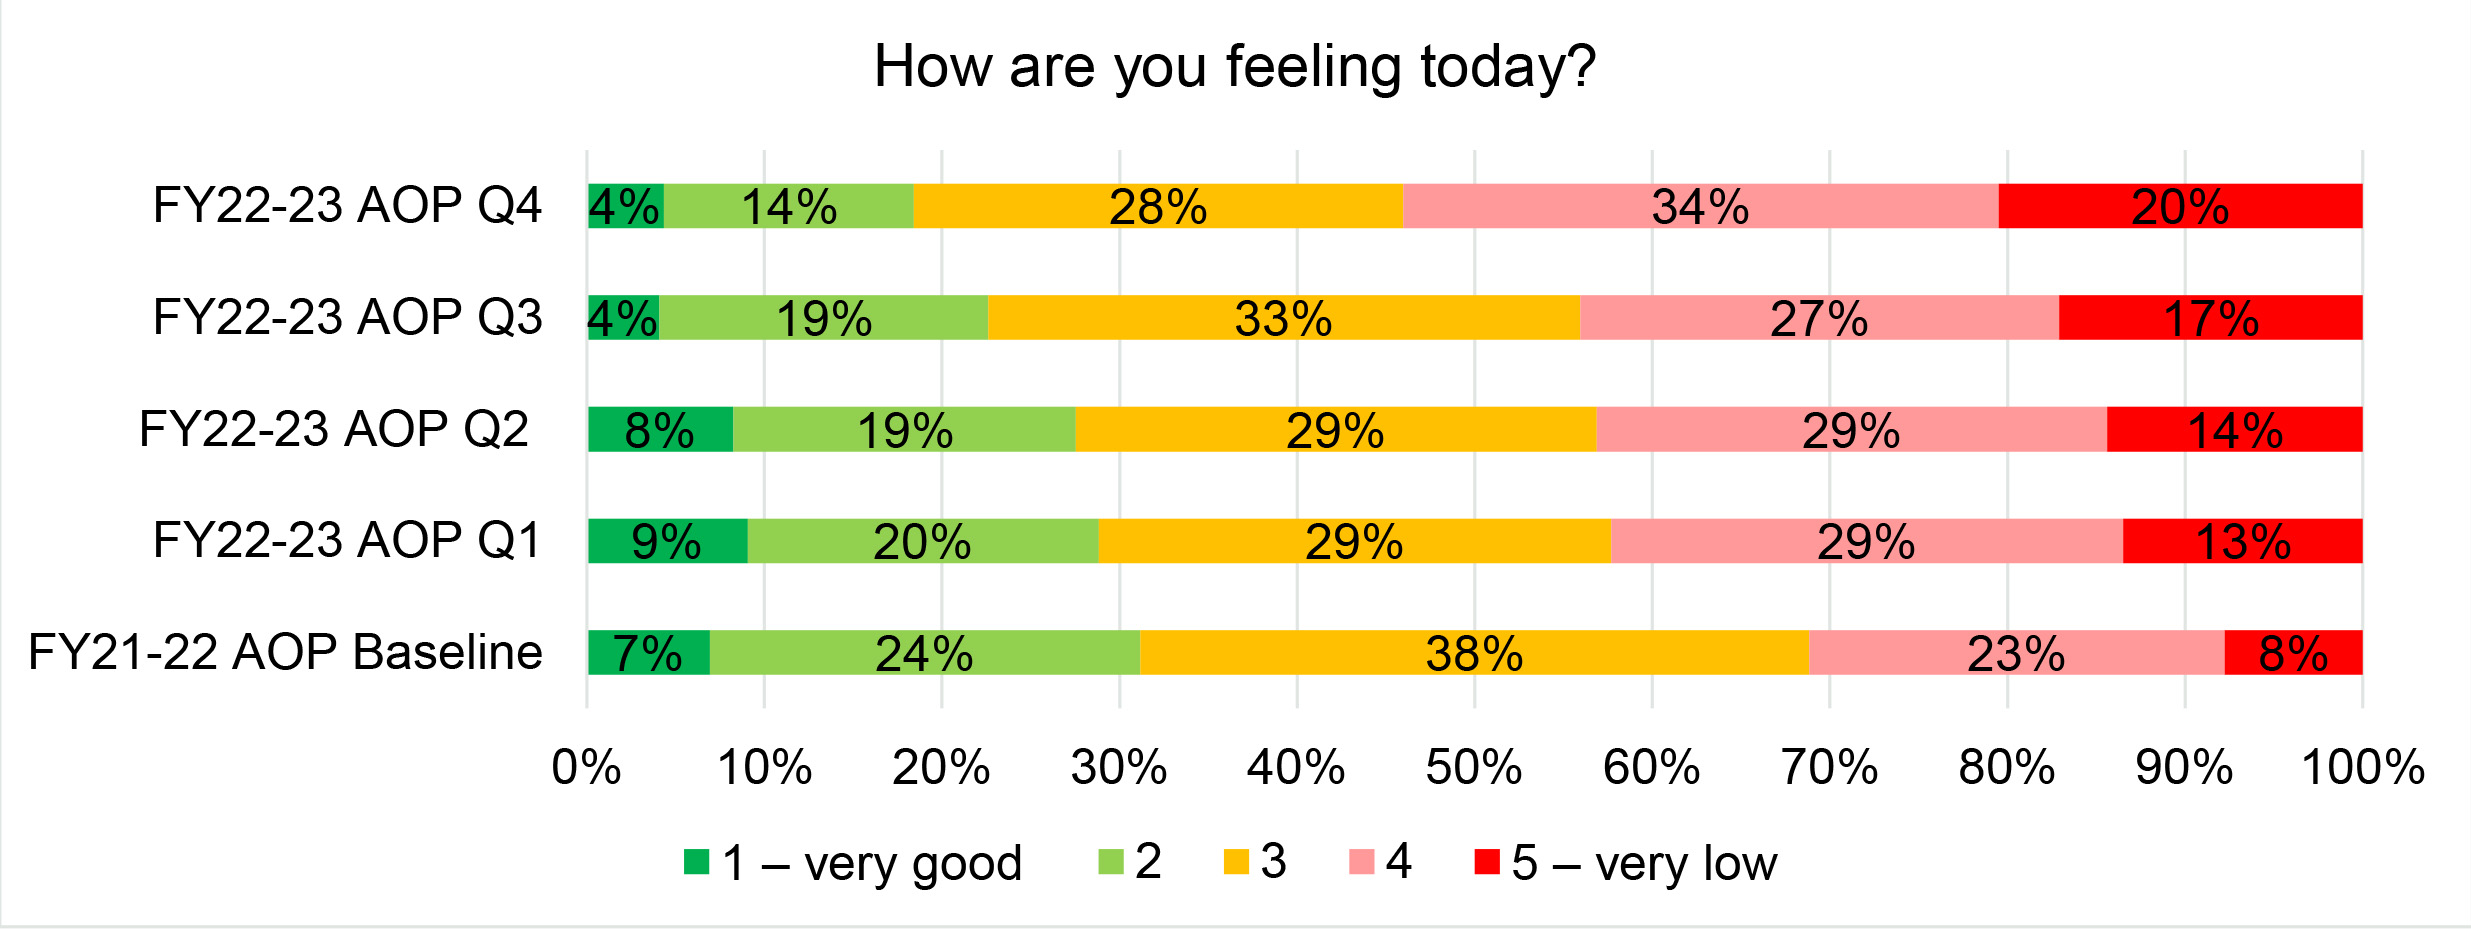
The Office of National Statistics collects information on personal wellbeing across the UK. Their data shows that national wellbeing levels remain below pre-pandemic levels, with the cost-of-living crisis having a significant impact. While the results of our surveys throughout the year were broadly in line with national trends, we recognise that the results for Quarter 4 are particularly concerning with over half of respondents rating their wellbeing as low or very low.
We asked people ‘How are you feeling today?’ which, given the complex range of factors impacting wellbeing, we now know was not sufficiently multidimensional.
In the survey conducted in December 2022, we asked two additional questions to provide insight into how staff were feeling, what was impacting that and how much of it could be attributed to work matters. We asked people to rank a range of factors in order, with the factor that was most impacting them ranked first. Respondents indicated that ‘Workload’ caused the biggest impact. Ensuring realistic workloads and a fair distribution of work is being acted on through the 2023-2024 Annual Operating Plan, supported by delivery plans which balance priorities and resources. In April 2023, we reintroduced boundaries around working hours which had been relaxed during the pandemic.
The pulse survey results in isolation, do not give us the information we need to judge how well the support we have put in place, and continue to develop, fully meets staff needs. In future, we will use a range of information and feedback to better understand staff wellbeing and engagement levels and what work issues are impacting them most. We retain a strong focus on positive health and workplace wellbeing which remains embedded in our work programme for 2023-2024.
Measure 10: Reduction in our direct greenhouse gas emissions by 70% from our 2006-2007 baseline
- CLT lead: Bridget Marshall
- Not achieved
We have not achieved this measure. Our total greenhouse gas emissions in 2006-2007 were 3,614 tonnes of carbon dioxide equivalents1. To meet a 70% reduction in direct greenhouse gas emissions, we would need to have emitted 1,084 tonnes of carbon dioxide equivalents or less over the course of the year, which is 271 tonnes of carbon dioxide equivalents each quarter.
Due to the lag in securing emissions data, this report is for Quarters 1, 2 and 3, providing information about buildings and travel emissions to 31 December 2022. Based on the trends in the table below, we predict that we will have reduced emissions this year by around 57% compared to our baseline. This is well below our 70% target and would represent a significant rise in emissions, of around 38%, compared to the previous two years.
| Emission source | 2022 - 2023 | Year to date | ||
|---|---|---|---|---|
| Q1 | Q2 | Q3 | ||
| Buildings | ||||
| Electricity use | 124.10 | 121.34 | 140.78 | 386.21 |
| Gas use | 30.15 | 53.16 | 56.21 | 139.52 |
| Oil use | 1.43 | 0.64 | 1.01 | 3.07 |
| Working from home (estimate) | 78.92 | 78.92 | 78.92 | 236.76 |
| Total buildings | 234.6 | 254.06 | 276.92 | 765.60 |
| SEPA travel | ||||
| Fleet vehicles | 30.64 | 38.17 | 27.22 | 96.02 |
| Hire cars | 9.95 | 2.31 | 3.42 | 15.70 |
| BCM (private car for work) miles | 58.4 | 65.79 | 61.52 | 185.70 |
| Flights | 12.9 | 1.72 | 1.57 | 16.20 |
| Ferries | 0.02 | 0.08 | 0.09 | 0.20 |
| Rail travel | 2.10 | 2.08 | 2.07 | 6.25 |
| Sir John Murray fuel use | 54.49 | 22.24 | 1.39 | 78.12 |
| Total travel | 168.50 | 132.39 | 97.28 | 398.20 |
| 2022-2023 emissions so far (target for 9 months is 813.15) | 1,163.80 | |||
There are two main reasons for our increased emissions:
As we have opened more offices over the year emissions from our buildings have increased. With the introduction of our hybrid working model, staff are also able to work from home. Working from home emissions are now a mandatory part of our emissions reporting to the Scottish Government. We therefore have two significant sources of buildings emissions where previously we only had one.
Emissions associated with travel have increased this year compared with the previous two years which were impacted by the COVID-19 pandemic.
1 Carbon dioxide equivalent is a standard unit of measurement that expresses the impact of each different greenhouse gas in terms of the amount of carbon dioxide that would cause the same level of warming.