Supporting information
This section goes into more detail on the data behind the report. SEPA gathers rainfall and river flow data from hundreds of sites across Scotland. We have a dedicated team of staff who do this work. We also monitor groundwater and loch levels and use soil moisture data from the Met Office. We compare the current conditions against the long-term values to see how dry (or wet) it has been.
Rainfall and river flows
3 months (winter)
The maps below show SEPA’s monitored rainfall (left) and river flow (right) from each monitoring station relative to the long-term average, for this time of year, over the last 3 months (winter).
There has been below average rainfall (quite dry [yellow] to very dry [dark orange]) across much of southern Scotland which is reflected in low (light orange) to very low (dark orange) river flows across the winter period. In northern Scotland rainfall has generally been normal (green), with the Moray coast and parts of Aberdeenshire experiencing wet (light blue) to very wet (dark blue) conditions. This is reflected in the normal (green) to very high (dark blue) flows. Shetland however, has experienced dry (light orange) conditions over the past 3 months which has resulted in low (light orange) flows.
![Map of Scotland showing rainfall from each monitoring station, relative to the long-term average, for this time of year over 3 months (winter).There has been below average rainfall (quite dry [yellow] to very dry [dark orange]) across much of southern Scotland. In northern Scotland rainfall has generally been normal (green), with the Moray coast and parts of Aberdeenshire experiencing wet (light blue) to very wet (dark blue) conditions.](/media/juhmlbja/npi-90-days-final.png?width=450&height=500&v=1db8db7069d5f30)
Map of Scotland showing rainfall from each monitoring station relative to the long-term average, for this time of year, over the last 3 months.
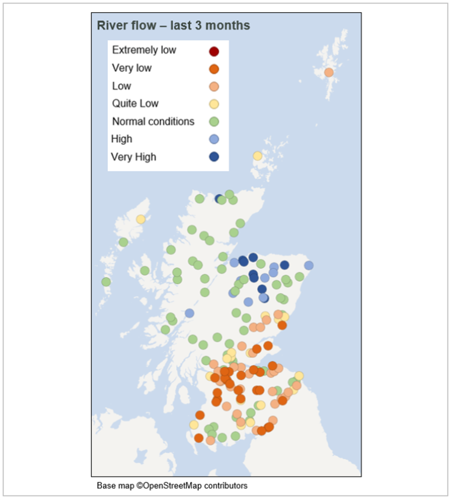
Map of Scotland showing river flows from each monitoring station relative to the long-term average, for this time of year, over the last 3 months.
6 months (autumn and winter)
The maps below show SEPA’s monitored rainfall (left) and river flow (right) from each monitoring station relative to the long-term average, for this time of year, over the last 6 months (autumn and winter combined).
Rainfall conditions across much of southern Scotland has been dry (light orange) to extremally dry (red) over the past 6 months. This is reflected in low (light orange) to extremally low (red) river flows. In northern Scotland, rainfall conditions have generally been normal (green) to quite dry (yellow). There are areas of the far north and Aberdeenshire however that have had dry (light orange) to very dry (dark orange) rainfall conditions. As a result, flows have generally been normal (green) to low (light orange).
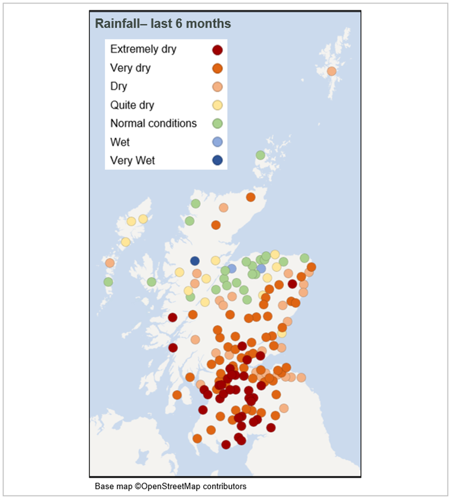
Map of Scotland showing rainfall from each monitoring station, relative to the long-term average, for this time of year, over the last 6 months.
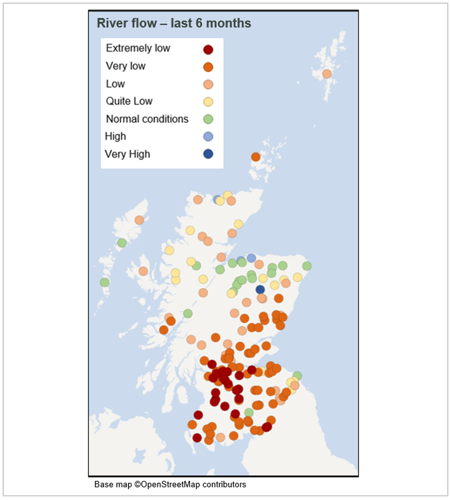
Map of Scotland showing river flow from each monitoring station, relative to the long-term average, for this time of year, over the last 6 months.
Natural water storage
In each river catchment there is some degree of natural water storage, which can maintain river flows even when it is not raining. This natural water storage is mainly held in lochs and groundwater. When storage has been depleted it will take a lot of rainfall for levels to recover.
The maps below show recent groundwater and loch level compared to the long-term record at each individual station. Level is reported as high or low compared to the typical (‘normal’) level range for the time of year. Level ranges are specific to each station and based on the long-term (minimum 10 years) record of mean monthly level values recorded at individual stations.
Groundwater levels
The groundwater levels from our monitoring points are normal (green) to low (light orange) for the time of year, with particularly low values recorded in the Fife, Angus and Dumfries regions. This corresponds to lower than average rainfall over the winter. The low values recorded in Fife are comparable to, or in some instances lower than, levels recorded in February 2022. The lower than normal groundwater levels in Winter 2022 preceded a period of drought over summer 2022.
Groundwater levels can be impacted by a number of factors including rainfall, soil/rock type and proximity to a watercourse.
A map of Scotland showing how the mean monthly groundwater level for February compares to the long-term record at each individual station.
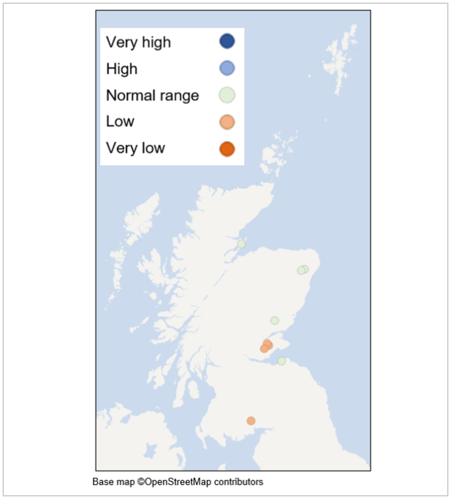
Loch levels
Loch levels in west of the country are broadly within the typical range (green) for this time of year. A couple of locations in central Scotland are now very low (dark orange) while in the far north, one location is low (light orange) for the time of year following a relatively dry autumn.
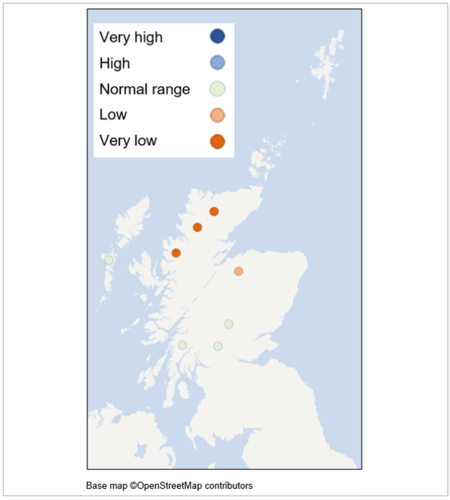
A map of Scotland showing how the mean monthly loch level for February compares to the long-term record at each individual station.
Flow, rainfall and groundwater data are accessed via SEPA’s time series data service (API). SEPA's live data are subject to ongoing quality control and periodic review.