Water scarcity report - 25 April 2025
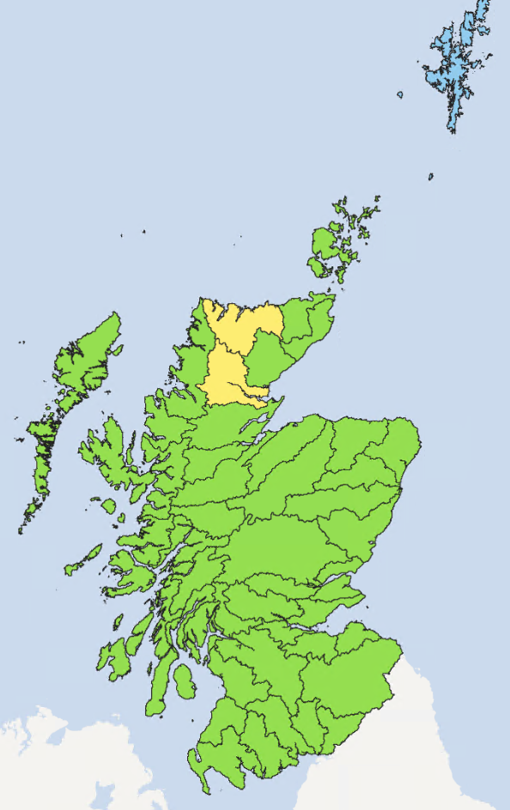
The Shin and Naver catchments have been raised to Alert. The rest of the country remains at Early Warning, with Shetland at Normal Conditions.
Situation summary
Due to prolonged dry weather, river levels in the Shin and Naver catchments are extremely low. With little forecast rain over the coming days, these two catchments have therefore been raised to Alert.
The recent rain in parts of Scotland has not been enough to result in significant recovery. As a result, the rest of the country remains at Early Warning, with Shetland at Normal conditions.
What do the map colours mean?
| Normal conditions | Early warning | Alert | Moderate scarcity | Significant scarcity |
|---|---|---|---|---|
| Blue | Green | Yellow | Orange | Red |
Water scarcity area descriptions
Weather Forecast
The rain band spreads further east on Saturday bringing rain to the south of Scotland and some lighter patchy outbreaks to the northeast. Turning drier from the west throughout the day with rain clearing all parts in the evening. Rain moves over the north and west through Sunday and brings heavy and persistent rain over the northwest which is also likely to last throughout Monday, drier in the south and east. A few showers in the far north on Tuesday but otherwise generally dry.
Advice for water users
We advise water users, including those with private water supplies, to be aware of the potential risk of water scarcity this summer, and for businesses to plan ahead where possible. Advice for abstractors and irrigators.
Supporting information
This section goes into more detail on the data behind the water scarcity levels.
Rainfall and river flows
These maps show rainfall and river flows relative to the long-term average, for this time of year, over 1 month, 3 months, and 6 months.
Over the past month there have been quite dry or dry conditions across the north, northeast and parts of the southeast with normal conditions elsewhere. River flows have generally been extremely low to low across most of the country, with some quite low flows in parts of the moray coast, central and western Scotland.
Over the last 3 months there have been extremely dry to dry conditions, with quite dry to normal conditions more prevalent in the southern highlands and parts of central and southern Scotland. Edinburgh and the Lothians however has experienced extremely dry conditions. This is reflected in the extremely low to very low flows across much of the country.
Due to a dry autumn and winter, extremely dry to dry conditions have been experienced across much of Scotland over the past 6 months. As a result, there have been extremely low river flows in much of the south. Parts of the north have experienced normal to quite dry conditions and river flows along parts of the moray coast have been normal to high. The rest of northern Scotland has generally experienced quite low to very low river levels.
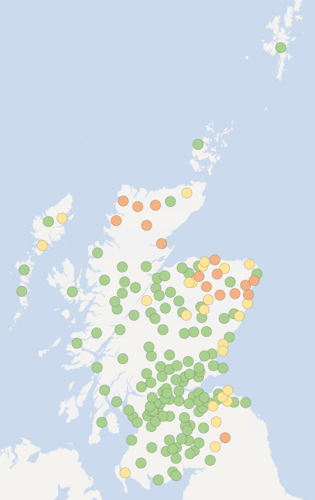
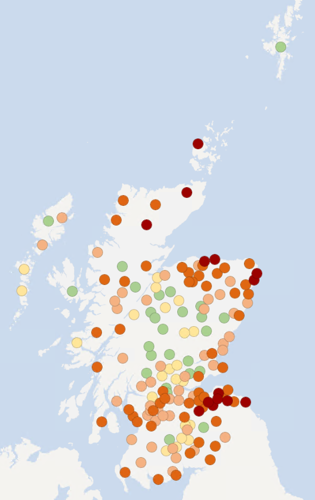
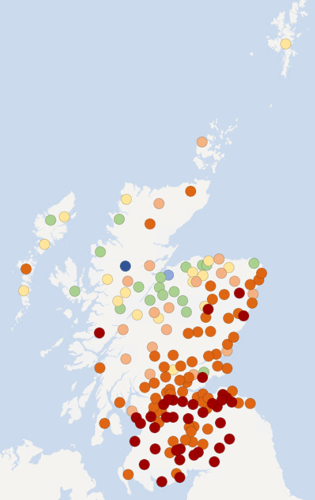
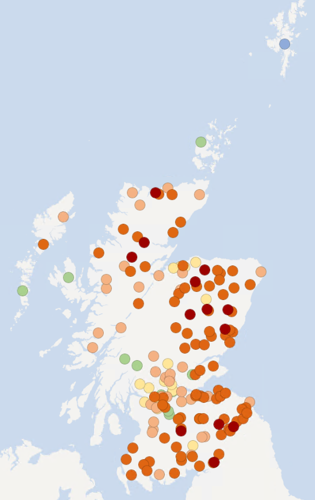
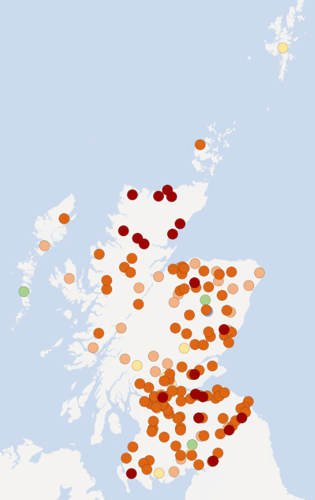
What do the map colours mean?
| Rainfall | Extremely dry | Very dry | Dry | Quite dry | Normal conditions | Wet | Very wet |
|---|---|---|---|---|---|---|---|
| River flow | Extremely low | Very low | Low | Quite low | Normal conditions | High | Very high |
| Red | Orange | Light orange | Yellow | Green | Light blue | Dark blue |
Soil moisture deficit
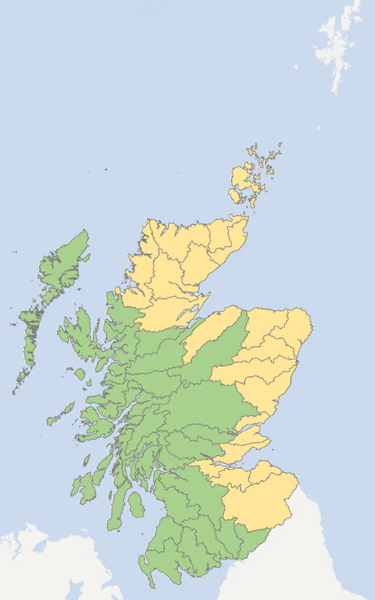
This map shows this week’s soil moisture deficit. This is obtained from the Met Office Rainfall and Evaporation Calculation System (MORECS). Ground conditions are quite dry across parts of the north, northeast and east of Scotland. Elsewhere there is no soil moisture deficit.
What do the map colours mean?
| Extremely dry | Very dry | Dry | Quite dry | No deficit |
|---|---|---|---|---|
| Red | Orange | Light orange | Yellow | Green |
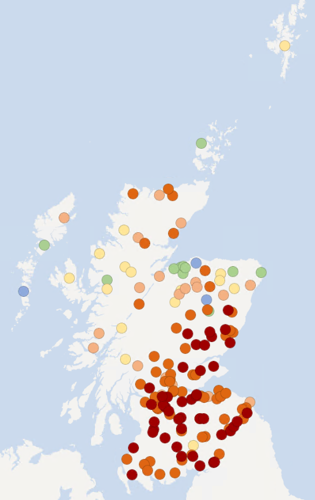
Natural water storage – groundwater and loch levels
In each river catchment there is some degree of natural water storage, which can maintain river flows even when it is not raining. This natural water storage is mainly held in lochs and groundwater. When storage has been depleted it will take a lot of rainfall for levels to recover.
The maps below show recent groundwater and loch level compared to the long-term record at each individual station. Level is reported as high or low compared to the typical (‘normal’) level range for the time of year.
Level ranges are specific to each station and based on the long-term (minimum 10 years) record of mean monthly level values recorded at individual stations.
Groundwater levels, from our monitoring points, are generally low to very low for the time of year. This is due to the limited recharge over the winter period. Groundwater levels are lower than levels recorded at the beginning of April 2022, particularly in Fife and Angus. Low groundwater levels in April 2022 were followed by a period of drought in summer 2022. Only groundwater levels in the Moray area are above normal for the time of year which reflects the higher-than-average rainfall in this area over the winter period.
Loch levels, from our monitoring points, are generally normal for this time of year, with some stations in the far north, moray area and central Scotland showing low levels.
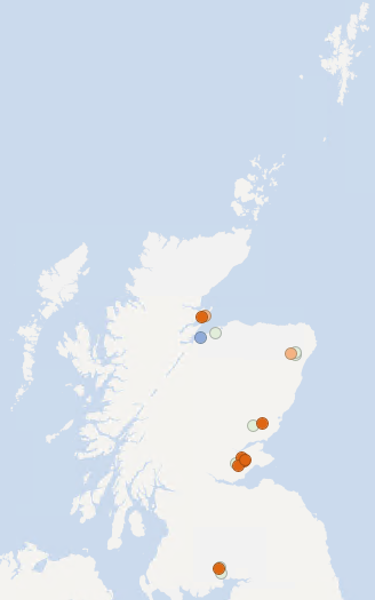
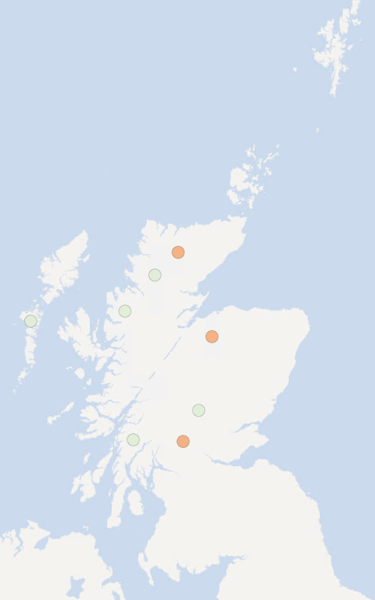
What do the map colours mean?
| Very high | High | Normal range | Low | Very low |
|---|---|---|---|---|
| Dark blue | Light blue | Light green | Light orange | Dark orange |
Flow, rainfall and groundwater data are accessed via SEPA's time series data service (API). SEPA's live data are subject to ongoing quality control and periodic review.
Scottish Water are responsible for public water supply and distribution in Scotland. Scottish Water reports on the raw water stored in these supplies.
Report copyright
- Current water scarcity levels - © SEPA. Some features of this information are based on digital spatial data licensed from the Centre for Ecology and Hydrology © NERC (CEH). Contains OS data © Crown copyright (and database right).
- Areas of significant water scarcity - OS Data - © Crown Copyright - SEPA licence number 100016991 (2022)
- Rainfall, river flow, groundwater and loch levels - Base map © OpenStreetMap contributors.
- Soil moisture deficit - Data based on MORECS (Met Office © Crown Copyright). Some features of this information are based on digital spatial data licensed from the Centre for Ecology and Hydrology © NERC (CEH). Contains OS data © Crown copyright (and database right). Base map © OpenStreetMap contributors.
- Weather forecast - Crown copyright [2022], Met Office