Water scarcity report - 24 July 2025
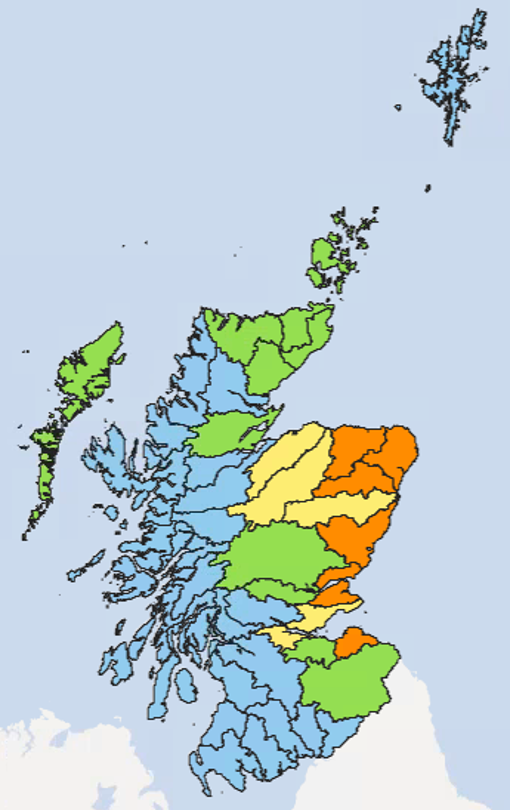
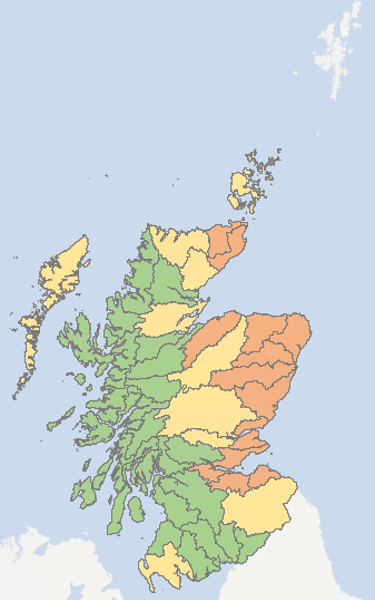
The Deveron, Ythan, Don (Aberdeenshire), Esk, Firth of Tay and Tyne (Lothian) river catchments remain at Moderate Water Scarcity.
The Spey and Dee (Aberdeen) have recovered to Alert and the Findhorn and Firth of Forth remain at Alert.
The Outer Hebrides and Orkney catchments have been raised to Early Warning, while the Helmsdale catchment has recovered to Early Warning and the Shin, Beauly, Ness and Lochy (Invernessshire) catchments have recovered to Normal Conditions.
The rest of the country remains at Early Warning or Normal Conditions.
Situation summary
Recent heavy rainfall has allowed for some recovery in water scarcity across parts of the country. However, ground conditions remain dry across the east and with the exceptionally dry first half of the year and limited recharge of groundwater stores over winter, river levels are quickly falling back to very low flows in places. Prolonged periods at such low flows puts pressure on these ecosystems, potentially causing impacts which may take a long time to recover from.
Moderate Water Scarcity remains in the Deveron, Ythan, Don (Aberdeenshire), Esk, Firth of Tay and Tyne (Lothian) river catchments.
The Spey and Dee (Aberdeen) have recovered to Alert and the Findhorn and Firth of Forth remain at Alert.
Due to continued dry conditions, the Outer Hebrides and Orkney catchments have been raised to Early Warning.
After the recent rainfall, the Helmsdale catchment has recovered to Early Warning and the Shin, Beauly, Ness and Lochy (Invernessshire) catchments have recovered to Normal Conditions.
The rest of the country remains at Early Warning or Normal Conditions.
What do the map colours mean?
| Normal conditions | Early warning | Alert | Moderate scarcity | Significant scarcity |
|---|---|---|---|---|
| Blue | Green | Yellow | Orange | Red |
Water scarcity area descriptions
Weather Forecast
Patchy rain across the north and east soon dying out to leave Thursday afternoon dry. Outbreaks of rain edge into western and central Scotland overnight, the rain becoming patchier as it clears SE through Friday, with showers following in the NW. Showers over the weekend, heaviest and most frequent in north and
west, perhaps a longer spell of rain in north early Sunday. Outbreaks of rain spread NE from mid -morning Monday.
Advice for water users
We advise water users, including those with private water supplies, to be aware of the potential risk of water scarcity this summer, and for businesses to plan ahead where possible. Advice for abstractors and irrigators.
Supporting information
This section goes into more detail on the data behind the water scarcity levels.
Rainfall and river flows
These maps show rainfall and river flows relative to the long-term average, for this time of year, over 1 month, 3 months, and 6 months.
Across Scotland, the 30-day average rainfall shows mostly normal conditions, although parts of the northwest have experienced wet conditions. River flows over the past 30 days continue to display an east to west split across Scotland. Eastern areas are seeing mostly low to very low flows, while western regions generally have high to very high flows. The Northern Isles are also experiencing very high flows.
Rainfall over the last three months also shows an east to west split across Scotland. Western Scotland has seen mainly normal to very wet conditions, while parts of the east remain quite dry to very dry. River flows for the last three months remain extremely low overall in the east, while normal to very high river flows can be seen in the Northern Isles and the west of Scotland.
Rainfall over the past six months show mostly dry to very dry conditions in the east and south of Scotland, with mostly normal to quite dry conditions in the west of the country. River flows across much of the country remain extremely low to very low for the past six months, although the Outer Hebrides and Shetland show normal conditions.
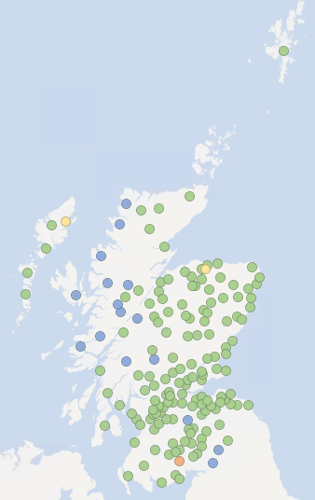
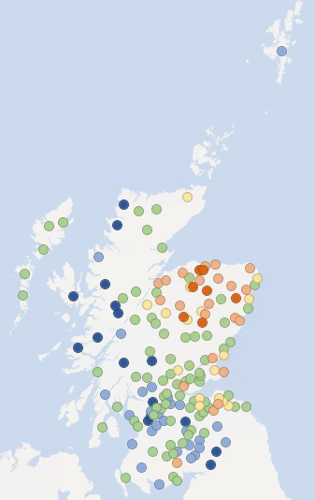
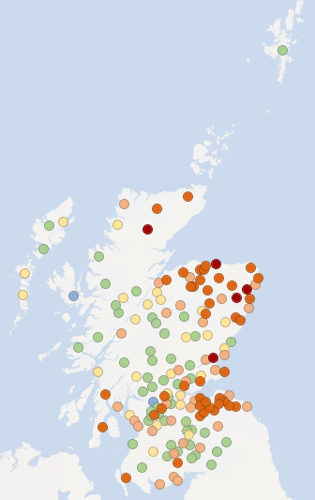
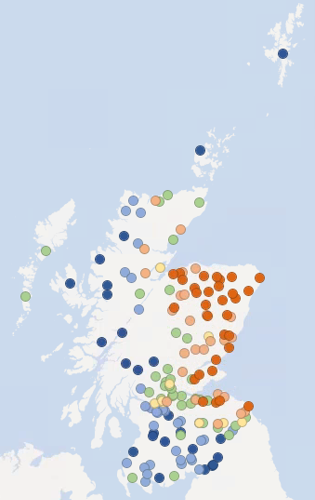
What do the map colours mean?
| Rainfall | Extremely dry | Very dry | Dry | Quite dry | Normal conditions | Wet | Very wet |
|---|---|---|---|---|---|---|---|
| River flow | Extremely low | Very low | Low | Quite low | Normal conditions | High | Very high |
| Red | Orange | Light orange | Yellow | Green | Light blue | Dark blue |
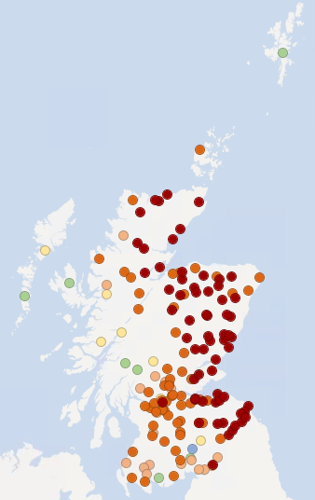
Soil moisture deficit
This map shows this week’s soil moisture deficit. This is obtained from the Met Office Rainfall and Evaporation Calculation System (MORECS). Ground conditions across the east are dry or quite dry. Apart from the far southwest and the Hebrides, which are quite dry, ground conditions in the west show no deficit.
What do the map colours mean?
| Extremely dry | Very dry | Dry | Quite dry | No deficit |
|---|---|---|---|---|
| Red | Orange | Light orange | Yellow | Green |
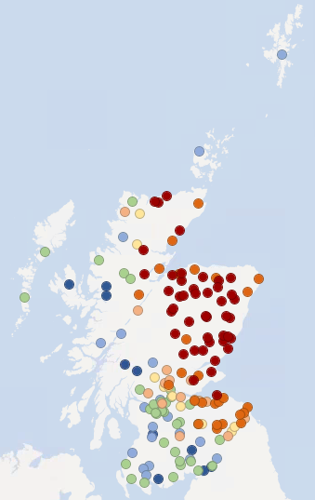
Natural water storage – groundwater and loch levels
In each river catchment there is some degree of natural water storage, which can maintain river flows even when it is not raining. This natural water storage is mainly held in lochs and groundwater. When storage has been depleted it will take a lot of rainfall for levels to recover.
The maps below show recent groundwater and loch level compared to the long-term record at each individual station. Level is reported as high or low compared to the typical (‘normal’) level range for the time of year.
Level ranges are specific to each station and based on the long-term (minimum 10 years) record of mean monthly level values recorded at individual stations.
Despite the recent rainfall, due to the lack of recharge over the autumn and winter, groundwater levels across most of the country remain low to very low for the time of year.
Locations in Fife have recorded their lowest levels for June on record and in its 28-year record the Newton of Falkland borehole has only recorded levels this low once before. The borehole at Murton in Angus has also recorded its lowest level for June in its 18-year record. Without significant rainfall, groundwater levels are expected to continue to fall over the summer.
Based on the June average loch levels from our monitoring points show very low levels in the northeast of Scotland with loch levels elsewhere between normal and very high.
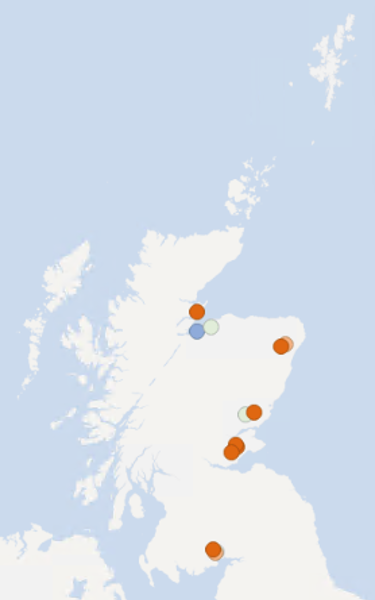
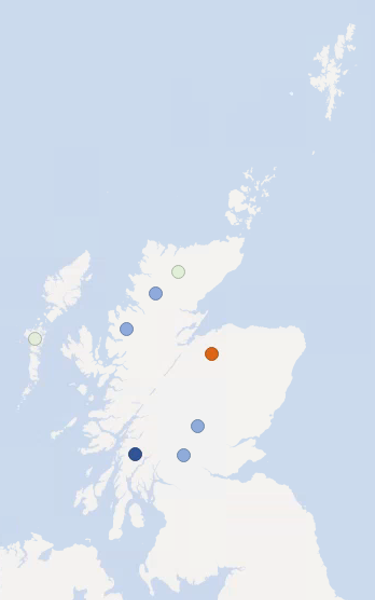
What do the map colours mean?
| Very high | High | Normal range | Low | Very low |
|---|---|---|---|---|
| Dark blue | Light blue | Light green | Light orange | Dark orange |
Flow, rainfall and groundwater data are accessed via SEPA's time series data service (API). SEPA's live data are subject to ongoing quality control and periodic review.
Scottish Water are responsible for public water supply and distribution in Scotland. Scottish Water reports on the raw water stored in these supplies.
Report copyright
- Current water scarcity levels - © SEPA. Some features of this information are based on digital spatial data licensed from the Centre for Ecology and Hydrology © NERC (CEH). Contains OS data © Crown copyright (and database right).
- Areas of significant water scarcity - OS Data - © Crown Copyright - SEPA licence number 100016991 (2022)
- Rainfall, river flow, groundwater and loch levels - Base map © OpenStreetMap contributors.
- Soil moisture deficit - Data based on MORECS (Met Office © Crown Copyright). Some features of this information are based on digital spatial data licensed from the Centre for Ecology and Hydrology © NERC (CEH). Contains OS data © Crown copyright (and database right). Base map © OpenStreetMap contributors.
- Weather forecast - Crown copyright [2022], Met Office