Equality Mainstreaming Report 2023
Chief Executive’s Foreword
I am committed to ensuring that equality, diversity and inclusion are at the heart of our service delivery for Scotland and the organisation itself.
Our previous mainstream report was published in 2021, following the global pandemic and a cyber-attack on our organisation. Since then, the world has changed again, with the war in Ukraine, the cost-of-living crisis and an acceleration in global warning and biodiversity loss. We recognise the potential impact these issues will likely have on equality and diversity, and we are working hard to ensure that we fulfil our duty to eliminate discrimination, to advance equality and to foster good relations.
To support this change, we published four new equality outcomes. These outcomes are our commitment to work to address long-standing or significant issues of inequality or underrepresentation, requiring us to act and go beyond basic compliance in mainstreaming equality.
Fundamental to achieving these outcomes is understanding lived experiences. We have established several lived experience groups, helping us think about the different needs that people have and the best way to meet their needs. They bring together staff members with shared characteristics and experience and provide a safe forum to raise issues that they have identified in the organisation. They also provide the organisation with an audience to consult on new policies, projects and services.
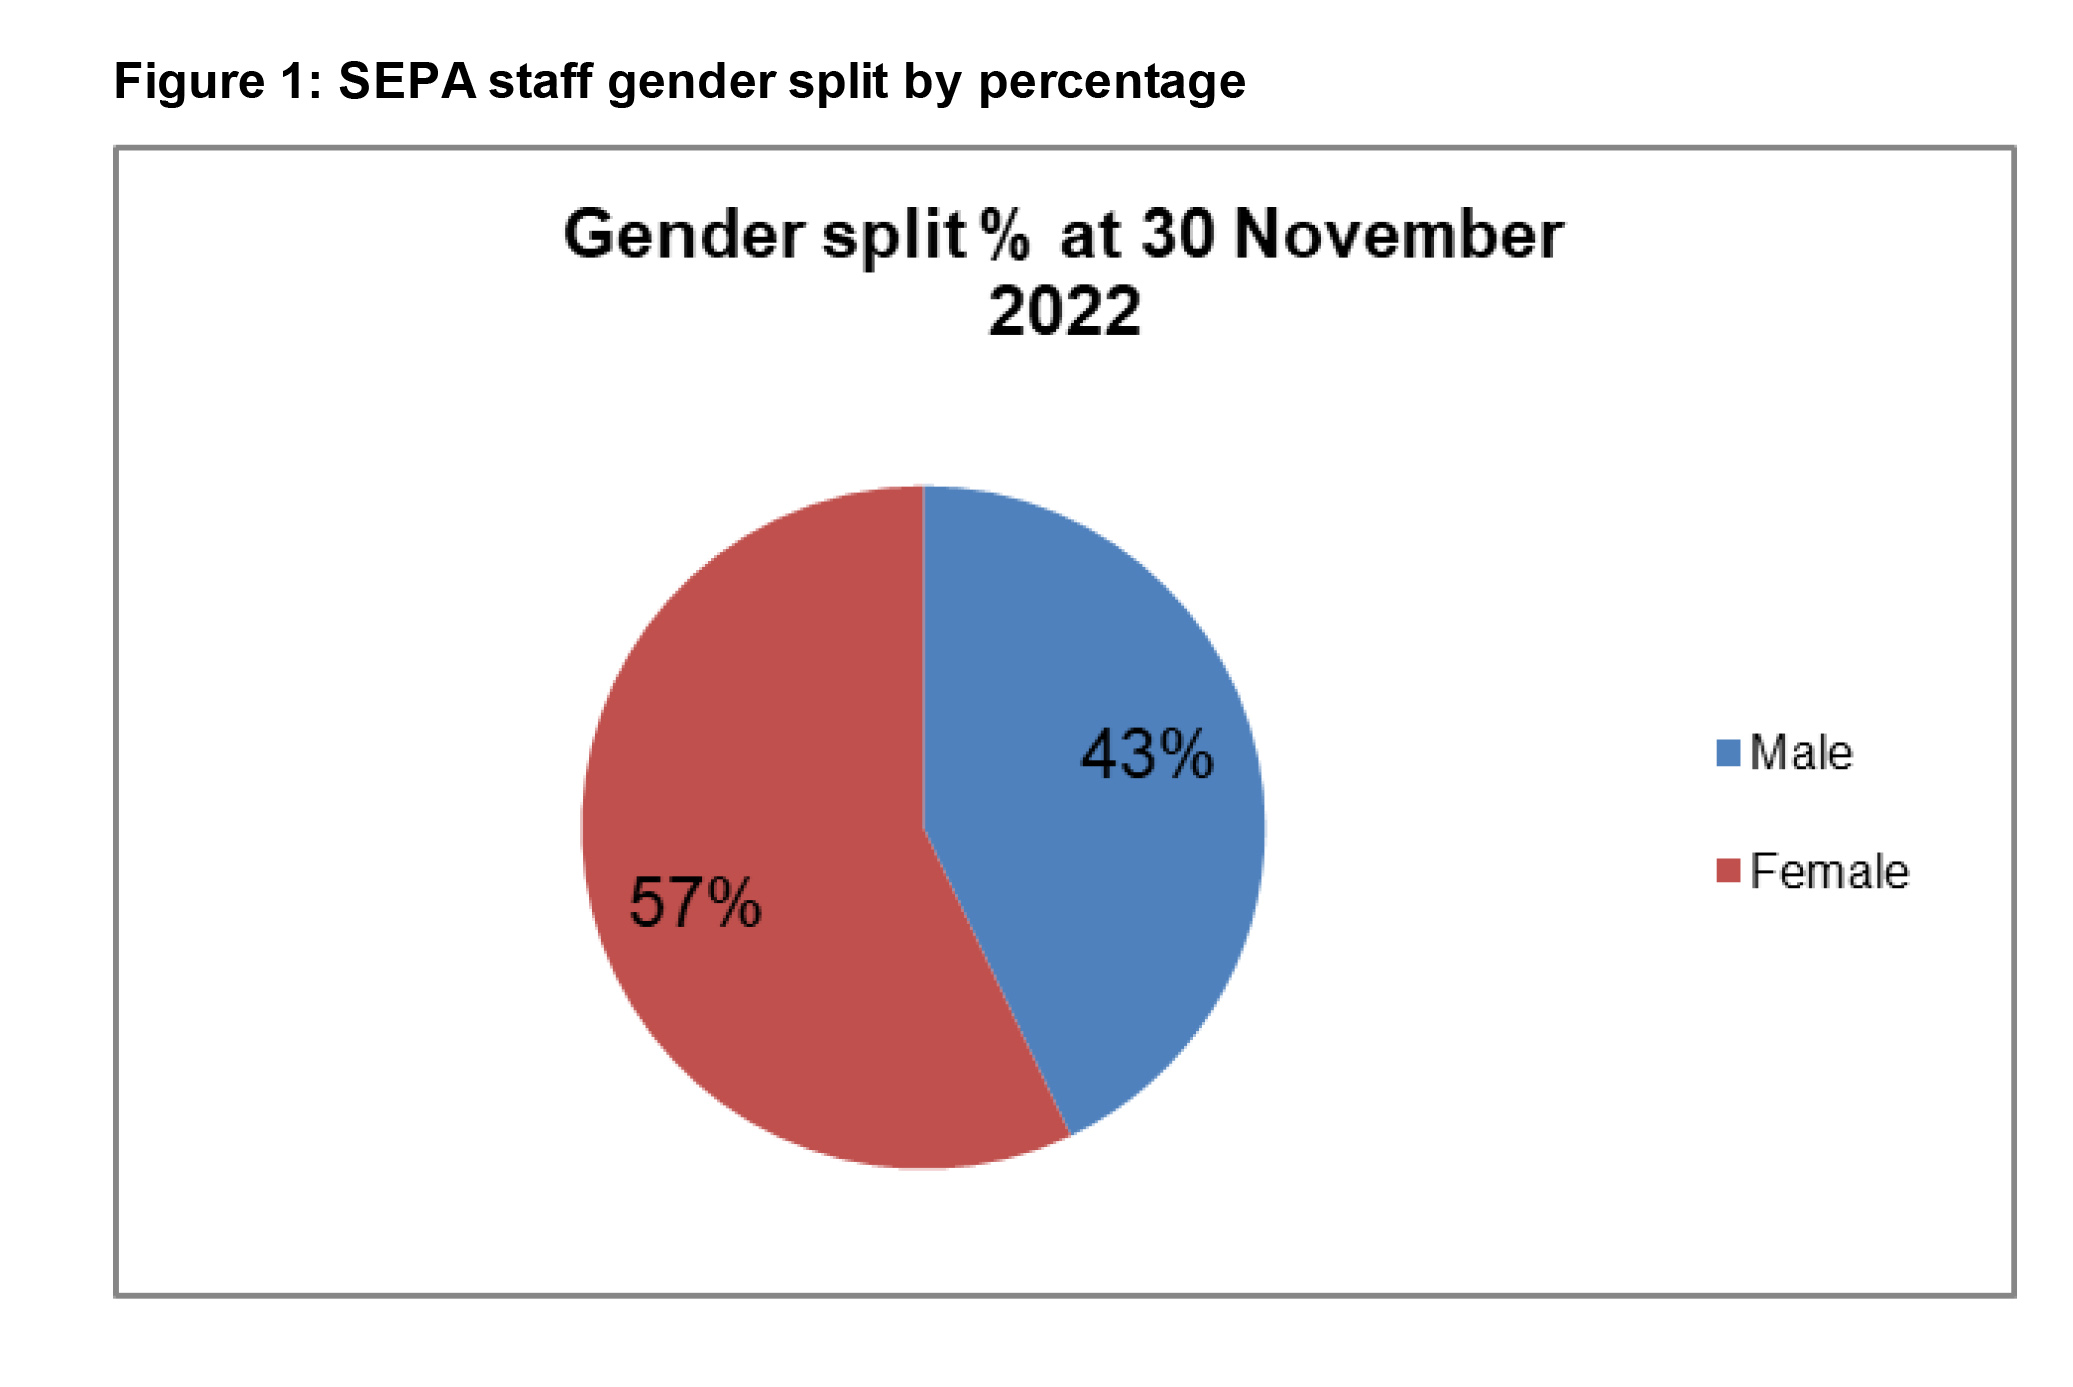
Decreasing our gender pay gap and occupational segregation related to gender, disability and ethnicity is also important to us. Whilst we have seen a small shift in our average overall organisation gender pay gap (from 9.25% to 7.53%) and the gender representation of our workforce (57% female and 43% male), we have also seen a continuing trend that female employees are under-represented at management grades and over-represented at lower grades.
This year will see the development of our new Corporate Plan and a strong focus on public sector reform. Several programmes will deliver the key objectives of building our services around people and communities, working with other organisations; promoting equality and seeking to improve performance. We will look for opportunities to co-design and implement our services for protecting and improving Scotland’s environment.
Equality is an integral part of our business, and we are proud of the progress we are making. We also recognise that there is more to do to meet our aspirations. I hope this report provides some assurance of our progress and look forward to more in the future.
Nicole Paterson
Chief Executive Officer
Introduction
Welcome to our Equality Mainstreaming and Outcomes Report 2023. The report demonstrates the progress we have made in mainstreaming equality and in the equality outcomes we set in 2017. The report also details our new equality outcomes, covering 2022-2026, and reflects the embedding and advancement of equality and diversity in relation to our people, including gender pay gap, and equal pay.
Structure of the report
- Section 1 - Report on mainstreaming the equality duty.
- Section 2 - Publish equality outcomes and report progress.
- Section 3 - Gather and use employee information.
- Section 4 - Publish information on board diversity and succession planning.
- Section 5 - Publish gender pay gap information.
- Section 6 - Publish statements on equal pay.
About us
We are Scotland’s principal environmental regulator. Our purpose is to protect and improve Scotland’s environment. Whilst doing so, we also help create health and wellbeing benefits and sustainable economic growth. We are a non-departmental public body of the Scottish Government delivering two fundamental services – Environmental Regulation and Flood Risk Management.
We employ over 1200 people across Scotland in a wide variety of roles, from scientists and regulators to administration officers and accountants, who all contribute to achieving our objectives and thenational outcomes set by the Scottish Government. Our current Corporate Plan 2017-2022 sets out four key outcomes:
- Scotland is thriving in a low carbon world.
- Scottish businesses are prospering from better environmental performance.
- The impact of flooding is reduced.
- People benefit from Scotland’s improving environment.
The Plan was intended to cover the period 2017-2022 but has been rolled over until 2024 following the global pandemic and a sophisticated cyber-attack on the organisation. Our next Corporate Plan will be published in 2024 and as part of its development we will take the opportunity to build upon the policies and legislation already in place to promote and advance equality in all that we do.
Who is involved in Equality and Human Rights in SEPA?
Equality responsibilities at SEPA
- Respect human rights and equality in every interaction - Responsibility of Everyone
- Set the strategic direction for equality and human rights and make sure we deliver it - Responsibility of Equality Oversight Group and Senior Leaders
- Develop the plans, tools and guidance and provide support to staff - Responsibility of Business Strategy, Human Resources, Communications and Marketing, Procurement and Facilities
- Provide advice on the laws - Responsibility of Corporate Legal, Regulatory Legal and Business Strategy
- Make sure we are trained - Responsibility of Learning and Development and Business Strategy
- Help us make reasonable adjustments - Responsibility of Health and Safety, Information Services, Human Resources, Business Strategy and Facilities
Section 1: Mainstreaming Equality
This section demonstrates our ongoing commitment to taking account of equality while undertaking our duties and activities and delivering our services and integrating equality into our day-to-day work.
Leadership and governance
In 2022, we established a People Committee as part of the Agency Board governance. The People Committee is responsible for supporting management in the development and wider organisational culture necessary to drive transformational change. It will also support management in the development of a People Strategy that reflects the vision, values, behaviours and competencies to delivery our services for Scotland.
Our Equality Oversight Group comprises senior management representatives from across the Agency with a mandate to help create a culture where: all staff can excel at work; our services meet all our customers’ needs; and we value diversity. The group’s monitoring and reviewing of progress helps to embed equality work in our annual regulatory, flooding and organisational priorities and promotes respect, equality and human rights across the organisation. Since its establishment in 2022, the Equality Oversight Group has held several workshops including neurodiversity, women in leadership, digital accessibility, and racism in the workplace.
Our lived experiences groups cover several areas including EU staff, digital accessibility and staff members experiencing long-covid symptoms. They bring together staff members with shared characteristics and experience and provide a safe forum to raise issues that they have identified in the organisation. They also provide the organisation with an audience to consult on new policies, projects and services.
As an organisation, our workforce is important to us and we need to understand our resources needs, skills and expertise required both now and in the future. We are currently developing our workforce plan to help us understand our future needs and inform our recruitment and succession planning.
Neurodiversity in the workplace
We are actively seeking to better understand neurodiversity in the workplace, understanding the needs of individuals and ensuring that reasonable adjustments are quickly put in place. Our Digital Accessibility Lived Experience Group, is providing advice and guidance for developing our services, reflecting their personal experiences of digital accessibility.
Our Equality Oversight Group recently received several presentations (both internal and external) in relation to neurodiversity in the workplace, hearing first-hand experience of members of staff and managers and exploring ways in which our organisation can be more neuro-inclusive.
We are piloting several concepts in relation to recruitment including advance notice of questions that will be asked at interview, reasonable adjustments and clearer job descriptions.
Health and well-being
We have recently introduced a well-being day for all staff for use during 2023. Recognising the challenges that staff have faced in recent years, the well-being day enables staff to take a day’s paid leave to support a well-being activity, providing an opportunity to reset and invest some time in themselves.
Flexible deployment
We have developed a new method for deploying staff to business-critical priorities. The approach enables staff to be involved in different pieces of work across the organisation and maximises the use of transferable skills (including problem solving, collaborative working and organisational knowledge).
It also creates better career development opportunities for our workforce and supports the development of our workforce plan which identifies the skills we need for the future, the gaps we need to address and opportunities for succession planning.
Our workspaces
Our workspaces form a significant component of our working environment and organisational culture. Following the global pandemic, during which our workspaces were closed, we took the opportunity to understand staff workspace preferences for the future. We issued a survey to all staff, first to gather basic information about preferences and workstyle profiles and, secondly, to help design workshops, team discussions and other mechanisms to develop our ideas and ultimately make decision on the future of our work.
Reasonable adjustments
We have been working to improve our approach to reasonable adjustments. Our initial focus was on the roll-out of assistive technology to staff members who need it, alongside the laptop and Microsoft 365 roll-out. Following this, we have focused on reviewing our guidance to ensure it remains in line with best practice and providing a better user experience than that experienced with previous systems.
Learning and development
Enabling our people to be the best they can be at work (both now and in the future) is vital to delivering a high-quality public service. To do this, we have continued to hold sessions for the senior management team, managers and staff bringing people together, providing briefings on key organisational issues and answering questions raised.
Our Staff Development Programme (including technical training) and Management Development Programme are centred on one of three modules: (i) myself, my skills and my behaviours, (ii) working with, and supporting others and (iii) the organisation and how we work.
Our Management Development Programme has been refocused to that it supports managers to look after themselves, look after staff and deliver our work programme. The Programme has run workshops for equality, creating and managing headspace in times ofpressures and developing personal resilience.
In July 2021, we launched a new Occupational Health portal with users receiving training on the portal. The online portal provides a secure way of referring and receiving Occupational Health reports.
Policies, procedures, guidance and support
We have a range of policies, procedures and guidance in place to promote equality and diversity in our workplace. We have equality expertise across the organisation, including Senior Human Resources Advisors who ensure equality in our recruitment, workforce policy and pay and a Solicitor who helps us understand the legal aspects of equality and diversity. We use equality and demographic data to help inform and influence our organisational policies and approaches.
Disability Confident Leader - We are a level two Disability Confident employer and advertise this on our recruitment website to encourage applications from people with disabilities. To achieve this accreditation, we self-assess our approach in two areas: (i) getting the right people for our business and (ii) keeping and developing our people. We are currently working towards becoming a Disability Confident Leader and hope to achieve this over the next year.
Living Wage Employer - We are proud to be one of Scotland’s Living Wage Employers and we actively promote the scheme when advertising posts.
Employee support - We offer a free, confidential Employee Assistance Programme to all our staff. This service provides counselling, signposting and information to help staff with personal or work-related problems that may be affecting their health, wellbeing or performance. It is accessed either online or through a 24-hour Freephone service. We have a range of Family Friendly policies and procedures to help staff plan and manage maternity, adoption and paternal leave.
Volunteering - Recognising the critical contribution volunteering makes in building a strong and cohesive society, we have increased our paid leave to carry out volunteering activities from one to two days a year. This allows employees to develop new skills, build important partnerships between charities and the public sector, and help break down barriers between different sections of society.
Pay policy - We follow the Scottish Government’s Pay Policy. This has prioritised protecting those on low pay through a progressive approach, delivered through the application of tiered pay increases.
Flexible Working Policy - We have several schemes which give staff flexibility to manage a good work-life balance whilst also meeting their work objectives. To promote our commitment to flexible working we advertise all our posts with the ‘Happy to Talk Flexible Working’ logo. Flexible options for staff include a flexi-time scheme, flexible working patterns including part-time or compressed hours, and flexible retirement. 25% of male staff members and 47% of female staff currently work to a flexible working pattern. 33% of our Corporate Leadership Team work to a flexible working pattern. 31% of female staff work part-time and six percent of male staff.
Menopause and Periods Policy - In October 2022, we launched our first Menopause and Periods Policy along with a dedicated staff page featuring useful learning resources. In addition, we recognised that the more we know about something, the easier it is to talk about it, offering virtual sessions to staff to hear from an HR expert, UNISON, and representatives from the Menopause and Periods Working Group about the practical support staff can expect if they need it. Our policy aims to promote an open and consistent approach to menopause and periods, focusing on the everyday supportive measures that we can offer to staff such as period products in offices and resources to help managers support their staff experiencing menopause or periods at work. It aims to increase awareness of periods and the menopause, promote an environment where staff feel confident to openly and comfortability discuss matters relating to periods and menopause, help us recruit and retain staff experiencing periods and the menopause and provides information on the practical everyday support that can be offered.
Hybrid Working Policy - The global pandemic triggered significant changes to the way we work, setting our staff up to work from home and changing the way we deliver our services. As such, we embraced the need for change and introduced a hybrid working policy. The policy provides clarify on our approach to hybrid working and enables conversations to achieve our ‘Future of Work Flexibility principle ‘works for the organisation, works for you’. The policy describes the options available to members of staff, how requests can be made and arrangements that apply to anyone who works from home (regardless of how often this may be the case).
As a first step to understanding staff workspace preferences, we issued a survey to all staff on 24 June 2021. It had a response rate of 82%. This survey focused on collating basic information about staff workspace preferences and workstyle profiles. The feedback was used to design workshops, team discussions, and other mechanisms to develop our ideas and ultimately, make decisions on the future of our work. An additional staff survey was conducted in February 2022, with the purpose of capturing geographical workspace preferences, along with the potential scale and pattern of usage of our workspaces. 80% of staff responded to this survey. We are also working with the Corporate Leadership Team to define our vision for the future of work and consolidate a clear understanding of our current position andopportunities (estate, Regenerative SEPA etc). Another way we are helping to inform Corporate Leadership Team and Board decision-making is by looking at what other organisations around the world are doing in relation to this opportunity.
Policy Development - Our work on policies is an ongoing process and we are currently working on a Transgender Equality Policy and Domestic Abuse and Gender Based Violence Policy.
Section 2: Equality Outcomes - Our progress
In 2017, we set out two outcomes:
- SEPA’s performance is enhanced by having a workforce whose diversity more closely reflects that of Scotland; and
- The people of Scotland, including minority communities, can readily access, understand and are enabled to act upon SEPA services.
SEPA’s performance is enhanced by having a workforce whose diversity more closely reflects that of Scotland
The delivery of services for Scotland depends wholly on the dedication , commitment and diversity of our people. We aim to enable people to be the best they can at work bringing a focus on the values and behaviours that are integral to a positive and supportive working culture. Our workforce planning plays an integral role in having an increased awareness of the capabilities and skills that SEPA needs for the future.
Our workforce
As an employer, we have 1,210 employees (as of 30 November 2022 based on headcount only) working in locations across the whole of Scotland, from Shetland in the north to Newton Stewart in the south.
We have a statutory responsibility to carry out monitoring on the protected characteristics of our workforce. This allows us to identify any gaps or issues in our recruitment and employment procedures. We currently monitor the characteristics of:
- our leavers;
- our recruitment process; and
- our staff promotions.
At present, we are considering how to enhance our workforce profile to ensure that we capture information for all protected characteristics.
Our monitoring highlights the differences between groups, such as minority groups, gender or staff in particular grades, in terms of satisfaction and progression. We are committed to ensuring employees or job applicants are treated with dignity and respect and will not be discriminated against on the grounds of any of the protected characteristics.
In relation to recruitment, HR monitors all job applications in terms of disability and liaises with the recruiting line manager to ensure that reasonable adjustments are applied during and after the onboarding process. All our job vacancies are advertised with the Happy to Talk Flexible Working Logo, and we are proud to be accredited Scottish Living Wage employers and we are proud to have achieved level 2 of the Disability Confident Employer.
Recruitment
Our data shows a continuing trend that female employees are underrepresented at management grades and overrepresented at lower grades. We aim to continue to address this differential through our new Equality Outcome ‘We increase the number of people from currently underrepresented groups in our applicants, our staff and those who progress within the organisation’.
Additionally, our reporting continues to highlight an ongoing trend relating to the low number of young people employed within SEPA. As of 30 November 2022, our workforce demographics highlighted that we had six staff members aged 16-24. Discussions are underway with functions within the business to facilitate further Modern Apprenticeship opportunities.
Flexible working
Our Flexible Working policy has been in place for some time and enables staff to request changes to their working pattern e.g., reduced hours, compressed hours, 134 (26%) of male staff members and 311 (45%) of females currently work to a flexible working pattern.
Maternity leave
During the period 1 December 2021 - 30 November 2022, 28 female members took maternity or adoption leave.
Paternity leave
During the period 1 December 2021 - 30 November 2022, 11 male members of staff took adoption, paternity or shared parental leave.
The people of Scotland, including minority communities, can readily access, understand and are enabled to act upon SEPA services.
Our key services – Environmental Regulation and Flood Risk Management – comprise of several components including the provision of information, advice and guidance, setting standards through permitting, environmental monitoring and co-ordination of flood risk management. The delivery of these services is for the people of Scotland and, as such, we recognise the importance of reflecting the different needs that people have and the best way to meet these needs.
A significant development for us is Scotland’s introduction of a deposit return scheme (DRS). This means that when someone buys a drink in a single-use container they will pay a 20p deposit, which is given back when the empty bottle or can is returned. We are the regulator for the scheme and are responsible for the producer registration service and checking compliance. To fulfil this responsibility, we will work with producers, retailers and the scheme administrator to help them to understand their obligations and what they need to do to comply with the scheme. We will publish information and guidance and will regularly monitor the service to ensure accessibility.
The online registration service has been developed in line with the Scottish Government’s digital strategy and Digital First assessment standards. Online forms have been simplified with one question per page, questions written in plain English and display fonts, colours and sizes of text and controls are clear, consistent and in line with recommended guidance. Forms have been accessibility-tested with users that have visual, hearing, physical and cognitive disabilities and the operational team will be available by email, phone, and MS Teams video call to provide help and assistance. Once the registration service goes live, there will be an opportunity for staff and stakeholders to provide feedback to help improve the service going forward.
In the face of the climate emergency, our flood risk management service has become ever more important. Currently, there are around 284,000 homes, businesses and services at medium to high risk of flooding in Scotland. By the 2080s, this could increase by around another 110,000 as result of climate change. It more important than ever that planning decisions avoid putting people at risk by building in places that could flood, both now and in the future. To manage this risk, it is important that everyone has access to the same information to make decisions. To make this easier, we have increased the scale at which people can view our flood maps. This makes it easier for users to identify whether a site or property sits within an area that is at risk of flooding. The maps can now be viewed at roughly a 1 to 2,500 scale – previously the zoom was restricted to 1 to 20,000. We have produced new planning guidance to support this change.
To develop the Scottish Flood Forecast, we followed the Scottish Government endorsed service design approach. This has involved extensive user research with the public, community flood groups, emergency responders, partner organisations, us, and Met Office employees. The findings identified a need for flood information to be provided earlier, in a simple and clear way, with the ability to check where no significant flooding is expected. We worked closely with the Met Office accessibility tester to make sure the content is accessible to all. We also ensured adherence to our own accessibility checklist and compliance with the Public Sector Bodies (websites and mobile applications) Accessibility Regulations 2018.
New Equality Outcome 2022-2026
In 2022, we introduced new equality outcomes.
- Outcome 1 - We have increased the number of people from currently underrepresented groups in our applicants, our staff and those who progress with in the organisation.
- Outcome 2 - People with lived experience of inequality, related to a protected characteristic or socioeconomic status, access and use SEPA’s services without barriers.
- Outcome 3 - Staff with lived experience of inequality and barriers, and with a wide variety of needs, feel listened to and respected as SEPA meets those needs.
- Outcome 4 - We have decreased our gender pay gap and occupational segregation related to gender, disability and ethnicity.
Section 3: Our people
Employee information/workforce composition
The information provided in this section is taken from our Human Resources Management Information System and is valid at 30 November 2022. Numbers less than 10 are not disclosed to protect individual confidentiality and are marked as a *. Information not provided/not specified denotes that a member of staff has not supplied this information.
View Figure 1: SEPA staff gender split by percentage
Table 1: Current SEPA staff grading structure
| Grade | Description |
|---|---|
| Y | Members of Corporate Leadership Team: Chief Executive, Executive Directors, and Chief Officers |
| A | Members of Senior Management Teams |
| B | Managers of Managers or National Experts with management responsibility |
| C | Core Unit Manager or Technical Specialists |
| D | Manager/Supervisor or Technical roles |
| E | Core Officer/Technical roles |
| F | Support officer roles |
| G | Administrative roles |
| H | Building support roles |
| I | Trainee and Graduate Scheme |
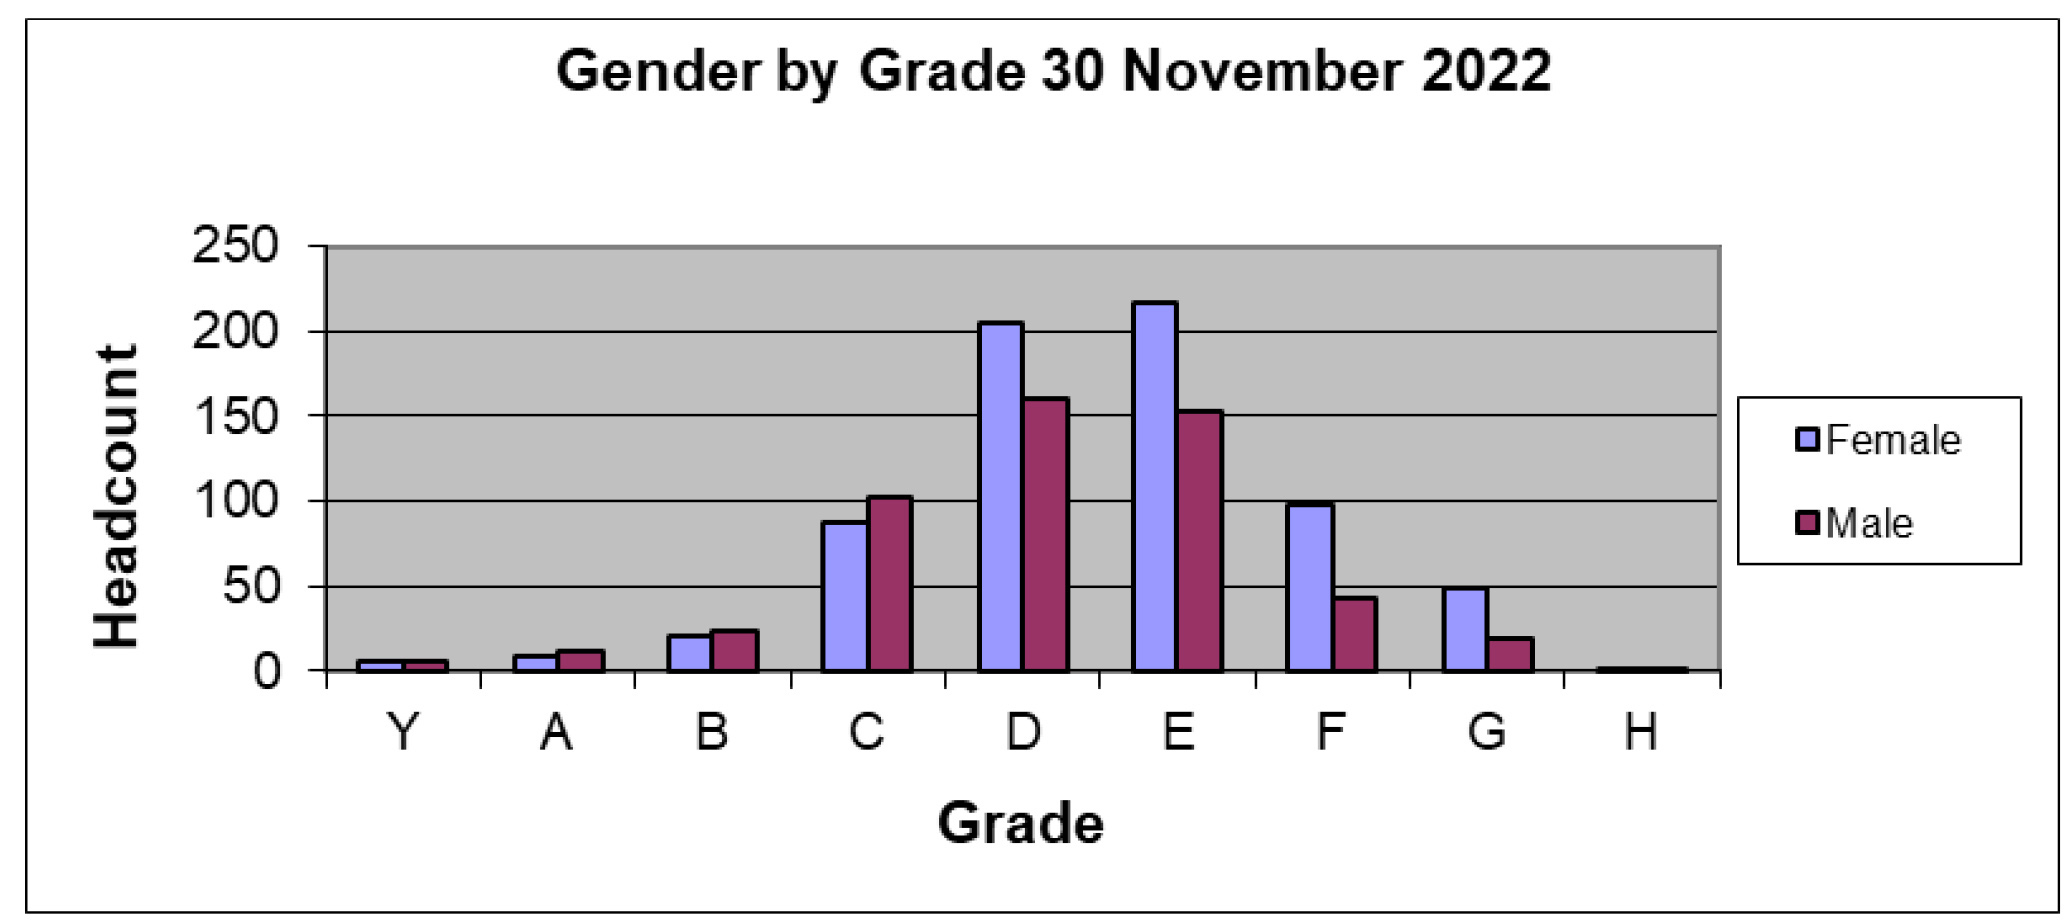
View Figure 2: SEPA staff gender by grade
Table 2: Equality information response rate
| Characteristic | Responses expected | Responses received as a number | Responses received as a percentage | Information not received as a number | Information not received as a percentage |
|---|---|---|---|---|---|
| Age | 1210 | 1210 | 100.00% | 0 | 0.00% |
| Gender | 1210 | 1210 | 100.00% | 0 | 0.00% |
| Disability | 1210 | 1062 | 87.77% | 148 | 12.23% |
| Marital status | 1210 | 1046 | 86.45% | 164 | 13.55% |
| Sexual orientation | 1210 | 920 | 76.03% | 290 | 23.97% |
| Religion | 1210 | 896 | 74.05% | 314 | 25.95% |
| Ethnicity | 1210 | 1042 | 86.12% | 168 | 10.50% |
It is important to note that the number of ‘information not received’ submissions is high compared to previous years. This is a consequence of the sophisticated cyber-attack on our organisation in 2020 and the subsequent rebuild of our Human Resources Management Information System and its reporting functionality. During 2023, we will encourage staff members to provide their equality data. Additionally, as part of this work, we will realign our reporting to ensure that it matches that of the 2021 census.
Table 3: Full time staff versus part time staff by gender
| Gender | Full time | Part time | % Full time | % Part time | Total of full and part time |
|---|---|---|---|---|---|
| Male | 493 | 26 | 94.99% | 5.01% | 519 |
| Female | 512 | 179 | 74.10% | 25.90% | 691 |
Table 4: Staff members’ age profile by gender
| Age range | Female | Male | Total of both female and males |
|---|---|---|---|
| 16-24 | * | * | * |
| 25-34 | 186 | 137 | 323 |
| 35-44 | 271 | 168 | 439 |
| 45-54 | 127 | 142 | 269 |
| 55-64 | 127 | 142 | 269 |
| 65 and over | * | 22 | 29 |
| Totals from all age ranges | 691 | 519 | 1210 |
Please note that * denotes a return of less than 10.
Table 5: Staff member's marital or civil partnership status
| Marital status | Number of staff | Number of staff as a percentage |
|---|---|---|
| Civil partnership | * | 0.17% |
| Divorced | 26 | 2.15% |
| Information not provided | 164 | 13.55% |
| Married | 583 | 48.18% |
| Not married | 422 | 34.88% |
| Separated | 10 | 0.83% |
| Widowed/Widower | * | 0.25% |
| Totals of all staff from all statuses | 1210 | 100.00% |
Please note that * denotes a return of less than 10.
Table 6: Disability status of SEPA staff
| Disability status | Number of staff | Percentage of staff |
|---|---|---|
| Disabled | 30 | 2.48% |
| Not disabled | 1032 | 85.29% |
| Information not provided | 148 | 12.23% |
| Total of all staff from all statuses | 1210 | 100.00% |
Table 7: Sexual orientation of SEPA staff by numbers and percentage
| Sexual orientation | Number of staff | Percentage of staff |
|---|---|---|
| Gay, Lesbian, Bi-Sexual or Other | 31 | 2.56% |
| Heterosexual | 881 | 73.47% |
| Prefer not to say | 290 | 23.97% |
| Total of staff from all orientations stated | 1210 | 100% |
Table 8: Religious beliefs of SEPA staff
| Religion | Number of staff | Percentage of staff |
|---|---|---|
| Roman Catholic | 91 | 7.52% |
| Church of Scotland | 207 | 17.11% |
| Other | 70 | 5.79% |
| None | 528 | 43.64% |
| Prefer not to say | 314 | 25.95% |
| Total of all staff from all religions stated | 1210 | 100% |
Table 9: Ethnic origin of SEPA staff
| Ethnic origin | Number of staff | Percentage of staff |
|---|---|---|
| Black, Asian, Mixed, Other | 30 | 2.48% |
| White Scottish | 589 | 48.68% |
| White British | 324 | 26.78% |
| White Other | 99 | 8.18% |
| Information not provided | 168 | 13.88% |
| Total of all of staff from all ethnic origins stated | 1210 | 100% |
We do not hold any equal opportunity information relating to gender re-assignment and therefore this protected characteristic has not been included.
Table 10: Staff grade mix by gender
| Grade | Female | Male | Total of both female and male |
|---|---|---|---|
| Y | * | * | 10 |
| A | * | 11 | 20 |
| B | 21 | 23 | 44 |
| C | 87 | 103 | 190 |
| D | 205 | 160 | 365 |
| E | 216 | 153 | 369 |
| F | 98 | 43 | 141 |
| G | 49 | 19 | 68 |
| H | * | * | * |
| Total of staff from all grades | 691 | 519 | 1210 |
Please note that * denotes a return of less than 10.
There is a continuing trend that female employees are under-represented at management grades and over-represented at lower grades. The majority of female employees are in Grades D, E, F and G, whilst in comparison the majority of male employees are in Grade C, D and E.
Recruitment
Our Human Resources Team monitors all job applications in terms of disability and liaises with recruiting line managers to ensure that reasonable adjustments are applied during and after the onboarding process.
The following data represents all job applicants from 1 December 2021 to 30 November 2022. Over this period, we conducted 210 recruitment campaigns, receiving 2404 applications and appointing 154 applicants. Table 11 reflects the status of the 210 campaigns:
Table 11: Recruitment status of campaigns
| Vacancy type | Total |
|---|---|
| Vacancies successfully recruited | 154 |
| Posts abandoned (unsuccessful) | 20 |
| Posts still to be advertised | 20 |
| Posts recruited via expressions of interest being submitted by internal candidates which was managed confidentially outwith our Applicant Tracker System | 16 |
| Totals of all vacancy types | 210 |
Table 12: Vacancies per Portfolio and Grade
| Grade | |||||||||
|---|---|---|---|---|---|---|---|---|---|
| Portfolio | Y | A | B | C | D | E | F | G | H |
| Compliance and Beyond | 1 | 0 | 2 | 13 | 13 | 28 | 4 | 0 | 0 |
| Circular Economy | 2 | 3 | 1 | 7 | 12 | 1 | 3 | 0 | 0 |
| Finance | 1 | 0 | 1 | 2 | 1 | 0 | 1 | 2 | 0 |
| Evidence and Flooding | 0 | 1 | 1 | 13 | 23 | 28 | 14 | 1 | 1 |
| Performance and Innovation | 0 | 0 | 0 | 2 | 9 | 3 | 3 | 1 | 0 |
| People and Property | 1 | 0 | 1 | 6 | 0 | 0 | 0 | 4 | 0 |
| Total | 5 | 4 | 6 | 43 | 58 | 60 | 25 | 8 | 1 |
Our recruitment system does not hold any equal opportunity information relating to gender re-assignment and therefore this protected characteristic has not been included.
Table 13: Job applicants to SEPA by gender
| Gender | Total applicants for campaigns | Number of successful applicants |
|---|---|---|
| Female | 947 | 85 |
| Male | 1249 | 62 |
| Not specified | 208 | * |
| Totals from all genders specified | 2404 | 154 |
Please note that * denotes a return of less than 10.
Table 14: Job applicants to SEPA by marital status
| Marital status | Total applicants for campaigns | Number of successful applicants |
|---|---|---|
| Civil partnership | 35 | * |
| Married | 849 | 72 |
| Not married | 1310 | 71 |
| Not specified | 210 | * |
| Totals from all statuses specified | 2404 | 154 |
Please note that * denotes a return of less than 10.
Table 15: Job applicants to SEPA by religious belief
| Religious belief | Total applicants for vacancy | Number of successful applicants |
|---|---|---|
| Roman Catholic | 164 | * |
| Church of Scotland, England and Wales | 213 | 14 |
| Other | 156 | * |
| None | 1405 | 99 |
| Not specified | 466 | 26 |
| Total from all statuses specified | 2404 | 154 |
Please note that * denotes a return of less than 10.
Table 16: Job applicants to SEPA by ethnic origin
| Ethnic origin | Total applicants for vacancy | Number of successful applicants |
|---|---|---|
| Black, Asian, Mixed, Other | 359 | 11 |
| White Scottish | 1339 | 87 |
| White British | 360 | 39 |
| White other | 37 | * |
| Not specified | 309 | 13 |
| Totals from all statuses specified | 2404 | 154 |
Please note that * denotes a return of less than 10.
Table 17: Job applicants to SEPA by disability
| Disability status | Total applicants for vacancy | Number of successful applicants |
|---|---|---|
| Disabled | 114 | * |
| Not disabled | 2082 | 136 |
| Not specified | 208 | * |
| Totals from all statuses specified | 2404 | 154 |
Please note that * denotes a return of less than 10.
Table 18: Job applicants to SEPA by sexual orientation
| Sexual orientation | Total applicants for campaigns | Number of successful applicants |
|---|---|---|
| Bisexual | 82 | * |
| Heterosexual | 1844 | 121 |
| Homosexual | 67 | * |
| Not specified | 411 | 25 |
| Totals from all statuses specified | 2404 | 154 |
Please note that * denotes a return of less than 10.
Table 19: Age range of job applicants to SEPA
| Age band | Total applicants for campaigns | Number of successful applicants |
|---|---|---|
| 16-24 | 240 | * |
| 25-34 | 755 | 44 |
| 34-44 | 563 | 47 |
| 45-54 | 417 | 37 |
| 55-64 | 211 | 13 |
| 64+ | * | 0 |
| Not specified | 209 | * |
| Totals from all statuses specified | 2404 | 154 |
Please note that * denotes a return of less than 10.
Staff promotions
From 1 December 2021 to 30 November 2022 there were 94 internal promotions (42 male and 52 female). Of those, 39 were temporary and 55 were permanent opportunities.
Table 20: Staff promotions in SEPA by grade and gender
| Grade | Female | Male | Total of both female and male |
|---|---|---|---|
| Y | * | * | * |
| A | * | * | * |
| B | * | * | * |
| C | 7 | 11 | 18 |
| D | 21 | 15 | 36 |
| E | 17 | * | 17 |
| F | * | * | * |
| Totals of all grades | 52 | 42 | 94 |
Please note that * denotes a return of less than 10.
Table 21: Staff promotions in SEPA by age and gender
| Age range | Female | Male | Total of both female and male |
|---|---|---|---|
| 16-24 | 0 | * | * |
| 25-34 | 17 | * | 17 |
| 34-44 | 13 | 18 | 31 |
| 45-54 | 19 | 11 | 30 |
| 55-64 | * | * | * |
| 65 and over | 0 | 0 | 0 |
| Totals from all age ranges specified | 52 | 42 | 94 |
Please note that * denotes a return of less than 10.
The following tables represent promotions by protected characteristic.
Table 22: Staff promotions in SEPA by disability
| Disability status | Percentage of staff |
|---|---|
| Not disabled | 88.30% |
| Disabled | 3.19% |
| Information not disclosed | 8.51% |
| Total of all statuses specified | 100.00% |
Table 23: Staff promotions in SEPA by ethnic origin
| Ethnic origin | Percentage of staff |
|---|---|
| Black, Asian, Mixed, Other | 1.06% |
| White Scottish | 53.19% |
| White British | 24.47% |
| White other | 10.64% |
| Information not provided | 10.64% |
| Total of all statuses specified | 100.00% |
Table 24: Staff promotions in SEPA by sexual orientation
| Sexual orientation | Percentage of staff |
|---|---|
| Gay, Lesbian, Bi-Sexual or Other | 2.13% |
| Heterosexual | 77.66% |
| Information not provided | 20.21% |
| Total of all statuses specified | 100.00% |
Table 25: Staff promotions in SEPA by religion and belief
| Religion and belief | Percentage of staff |
|---|---|
| Roman Catholic | 8.51% |
| Church of Scotland, England or Wales | 11.70% |
| Other | 7.54% |
| None | 54.26% |
| Information not provided | 18.09% |
| Total of all statuses specified | 100.00% |
Table 26: Staff promotions in SEPA by age
| Age range | Percentage of staff |
|---|---|
| 16 - 24 | 2.13% |
| 25 - 34 | 25.53% |
| 35 - 44 | 32.98% |
| 45 - 54 | 31.91% |
| 55 - 64 | 7.45% |
| 65 and over | 0.00% |
| Total of all age ranges specified | 100.00% |
Leavers and retention rate
SEPA measures its employee turnover rate as leavers as a percentage of headcount. From 1 December 2021 to 30 November 2022, the turnover rate was 7.42%. SEPA continues to have a low turnover rate in comparison to other organisations where the national average (all sectors) is 15% per year.
The following tables reflect leavers from 1 December 2021 - 30 November 2022 (including end of fixed term contracts, retirements, voluntary severance, dismissal and ill health retirements).
This information is presented by gender, disability, sexual orientation, religious belief, age and ethnic minority. We do not hold any equal opportunity information relating to gender re- assignment and therefore this has not been included.
Table 27: SEPA leavers by gender
| Gender | Percentage of leavers |
|---|---|
| Female | 44.44% |
| Male | 56.56% |
Table 28: SEPA leavers by grade mix and gender
| Grade | Female | Male | Total of both male and female |
|---|---|---|---|
| Y | * | * | * |
| A | * | 0 | * |
| B | * | * | * |
| C | * | 16 | 23 |
| D | 10 | * | 19 |
| E | 11 | 13 | 24 |
| F | * | * | 7 |
| G | * | * | * |
| H | 0 | 0 | 0 |
| T | 0 | 0 | 0 |
| Totals from all grades specified | 40 | 50 | 90 |
Please note that * denotes a return of less than 10.
Table 29: SEPA leavers by disability
| Disability status | Percentage of leavers |
|---|---|
| Disabled | 5.56% |
| Not Disabled | 76.67% |
| Information not provided | 17.18% |
| Total of all statuses specified | 100% |
Table 30: SEPA leavers by sexual orientation
| Sexual orientation | Percentage of leavers |
|---|---|
| Gay, Lesbian, Bi-Sexual or other | 1.11% |
| Heterosexual | 82.22% |
| Prefer not to say | 16.67% |
| Total of all statuses specified | 100% |
Table 31: SEPA leavers by religious belief
| Religious belief | Percentage of leavers |
|---|---|
| Church Scotland, England or Wales | 8.89% |
| Roman Catholic | 1.11% |
| None | 25.56% |
| Other | 3.33% |
| Prefer not to say | 61.11% |
| Total of all statuses specified | 100% |
Table 32: SEPA leavers by age
| Age range | Percentage of leavers |
|---|---|
| 16-24 | 0.0% |
| 25-34 | 13.3% |
| 35-44 | 20.0% |
| 45-54 | 21.1% |
| 55-64 | 35.6% |
| 65 and over | 10.0% |
| Total of all age ranges specified | 100% |
Table 33: SEPA leavers by ethnic origin
| Ethnic origin | Percentage of leavers |
|---|---|
| White | 94.44% |
| Ethnic minority | 1.11% |
| Other | 1.11% |
| Not provided | 3.33% |
| Total of all statuses specified | 100% |
Absence rates
Staff sickness absence reduces organisational productivity as a result of the “lost time” of the absent staff member but also the time spent by HR and managers on managing the absence.
In 2021-22, 1.99% of the available working time was lost due to sickness absence. The number of working days taken as sickness by all staff during 2021-202 was 5,917 The actual number of working days lost, averages 4.93 days per employee. Figures from 2020-21 are not available due to a cyber-attack.
Whilst in 2019-20, 4.28 % of the available working time was lost due to sickness absence. The number of working days taken as sickness by all staff during 2019-20 was 11,356 which is a 2.3% increase compared to 11,102 days recorded the previous year (2018-19). Our absence rates continue to be lower than the average public sector absence rates.
Section 4: Board diversity and succession planning
Our Board is responsible for the overall direction and performance of the organisation. Appointments to the Board are made by Scottish Ministers and are regulated by the Commissioner for Public Appointments in Scotland. Appointments are normally for a four year term with the possibility of a further term up to a maximum of a further four years subject to evidence of effective performance and satisfying the skills, knowledge and personal qualities required on the Board at the time of re-appointment.
We want a diverse Board to bring a range of ideas for driving forward our strategy and to stimulate healthy debate, leading to better decisions. A diverse Board helps us to better understand our customers and be more sensitive to a wider variety of groups. Since April 2015 the gender balance of non-executive members of our Board has remained 60% male and 40% female. This is despite a turnover of both male and female members leaving and joining the Board over the last six years.
In 2021, we established a People Committee with the appointment of a male Chair. In January 2022 we appointed a new female Audit and Risk Committee Chair.
Table 34. SEPA Board membership summary
| Total Membership | Chair | Deputy Chair1 | Audit chair | CEO SEPA (executive member) | Non exec membership | Non exec membership % | |
|---|---|---|---|---|---|---|---|
| April 2015 | 7 Male 4 Female | M | M | M | M | 6 Male 4 Female | 60% Male 40% Female |
| April 2016 | 7 Male 4 Female | M | M | M | M | 6 Male 4 Female | 60% Male 40% Female |
| April 2017 | 7 Male 4 Female | M | F | F | M | 6 Male 4 Female | 60% Male 40% Female |
| April 2018 | 7 Male 4 Female | M | F | F | M | 6 Male 4 Female | 60% Male 40% Female |
| April 2019 | 7 Male 4 Female | M | F | F | M | 6 Male 4 Female | 60% Male 40% Female |
| April 2020 | 7 Male 4 Female | M | F | M | M | 6 Male 4 Female | 60% Male 40% Female |
| April 2021 | 7 Male 4 Female | M | F | M | M | 6 Male 4 Female | 60% Male 40% Female |
| April 2022 | 7 Male 4 Female | M | F | F | M | 6 Male 4 Female | 60% Male 40% Female |
1 Note: Between April 2015 and April 2019, the Deputy Chair and the Audit Chair was a combined position.
In 2019 we re-appointed our Chair and appointed four new Board members to start on 1 January 2020. This presented the opportunity to take a different approach to the recruitment process. Working with the Public Appointments Unit in the Scottish Government we took the following steps to widen the audience, better promote the role of board members and improve the wider diversity of the candidates:
- Revised the role description and personal specification.
- Produced videos by the Chair, Audit Chair, a mix of Board members, the Clerk to the Board and various individuals within the organisation who work closely with the Board, speaking on the role.
- Used the Board Succession and Diversity Board Buddy Group to look at the language used around the recruitment and worked with Changing the Chemistry on an event for perspective applicants.
- Worked with a variety of equality groups to promote vacancies.
- Used social media and equality organisations to advertise the vacancies, with links to the video and contacts.
- Created a Board recruitment information web page with the embedded video content, Frequently Asked Questions and a link to the information pack for applicants.
These activities will continue and, with the next round of recruitment due in 2023, we will focus on developing our approach to the attraction and selection of future board members. Specifically, we will:
- review the information available on the SEPA Board website to ensure there is a greater awareness of the role of the Board and individual Board members;
- work with Scottish Government Sponsor Unit and the Public Appointments Unit on developing future recruitment and selection campaigns to help increase the diversity of candidates;
- review the skills and experience that are used as the basis for the development, recruitment and selection of Board members;
- develop relationships with equality groups to promote greater understanding of the Board and its role and increase the diversity of candidates;
- begin the recruitment process for board re-appointments as well as appointments ending in December 2023.
As we develop our approach on the recruitment and selection of Board members, we will ensure that learning is connected into recruitment and selection for staff through the Board Succession and Diversity Board Buddy Group. This group was created to promote greater diversity when new members are recruited.
Section 5: Pay gaps and equal pay
Pay gap and occupational segregation
Gender pay gap
The gender pay gap is a measure of the difference between male and female mean earnings expressed as a percentage of male earnings. In line with guidance from the Equality and Human Rights Commission (EHRC) we report both the ‘mean’ and the ‘median’ pay gap. The gender pay gap calculation is based on basic hourly pay and does not reflect additional pay elements such as allowances or overtime.
The mean pay gap is the average hourly pay rate, calculated by adding the hourly pay rate for employees then dividing by number of employees. The median gender pay gap is calculated by finding the middle hourly rate when the pay rate is arranged in order from highest to lowest. Both mean and median are calculated for each gender with each pay grade and for the organisation overall. The mean and median gender pay gap for all employees as at 30 November 2022 can be found in Appendix 1 (Table 36).
Mean gender pay gap:
- We have an average overall organisational gender pay gap of 7.53%.
- The pay gap excluding our Q, our Corporate Leadership Team, is 7.29%, indicating that the higher pay, particularly of the males, in the Corporate Leadership Team group does impact on the overall mean gender pay gap.
- Our gender pay gap is less than the Scottish average figure, which was 10.1% for 2021
- We have no pay gap which would be rated as “significant” (a gap of more than 5%) and only the Q mean gap is above the cautionary level of 3%.
Median gender pay gap:
- Our overall median pay gap is 4.86% in favour of females.
- The most noticeable pay gap is for the Q pay grade, where it is 15.12%, due to the proportion of males being on higher pay steps.
- The pay gap is favourable compared to the UK and Scottish average figures of 15.4% and 11.5% respectively
The table below shows data for the last five years from the Office of National Statistics (ONS) Annual Survey of Hours and Earnings (ASHE) which reports the UK median gender pay gap and Close The Gap, which reports the Scottish mean and median gender pay gaps and how SEPA compares to these. The SEPA figures are based on financial year end data, as at 31 March.
Table 35: UK, Scotland and SEPA mean and median gender pay gap.
| Year | UK Mean | UK Median | Scotland Mean | Scotland Median | SEPA Mean | SEPA Median |
|---|---|---|---|---|---|---|
| 2021 | * | 15.40% | 10.10% | 11.50% | * | * |
| 2020 | * | 14.90% | 10.40% | 10.90% | * | * |
| 2019 | * | 17.40% | 13.30% | 14.30% | 10.34% | 6.87% |
| 2018 | 17.10% | 17.90% | 13.90% | 16.10% | 9.68% | 4.64% |
| 2017 | 17.20% | 18.40% | 15.20% | 15.00% | 9.86% | 6.95% |
*SEPA information is not available due to a significant cyber-attack in 2020.
In 2008, prior to the implementation of a new pay and grading structure, SEPA conducted an equal pay audit, which showed a gender pay gap of 17.7%. The aim of the pay and grading structure that was implemented was to bring transparency, consistency and equ ity to our pay structure, with a fixed number of grades and pay points and all staff treated equitably within this. This resulted in a noticeable decrease in our gender pay gap and annually, as the table above shows, we have continued to see a steady reduction in our gender pay gap, with SEPA being noticeably below both the UK and Scottish mean and median gender pay gaps.
Although organisationally, we have a higher proportion of female staff compared to male (57% to 43% respectively) our mean pay gap is accounted for by having greater numbers of female staff in the lower pay grades and a higher number of male staff on higher pay steps and grades. As SEPA is required to comply with the Scottish Government Public Sector Pay Policy and applies this equally to both male and female staff within each pay grade, it is difficult from a purely pay perspective to change and continue to reduce the gender pay gap. Whilst the staff demographic continues to have a higher proportion of male staff at higher pay grades and more females within the lower pay grades, it will be challenging to reduce the gender pay gap.
Race and disability pay gap
As well as the gender pay gap, in line with the Scottish Public Sector Equality Duties, we also analyse and publish the pay gap information for the protected characteristic groupings of race and disability.
Table 36. Pay gap information for Black/Asian and White Scottish staff.
| Pay Grade | Total No. Staff in Pay Grade | Black/Asian No. Staff | Black/Asian £ Mean Hourly | Black/Asian £ Median Hourly | White Scottish No. Staff | White Scottish £ Mean Hourly | White Scottish £ Median Hourly |
|---|---|---|---|---|---|---|---|
| Q, N & M | 10 | 0 | £0.00 | £0.00 | * | £52.03 | £51.43 |
| A | 20 | 0 | £0.00 | £0.00 | 11 | £39.92 | £40.44 |
| B | 44 | 0 | £0.00 | £0.00 | 19 | £32.79 | £33.06 |
| C | 190 | * | £27.81 | £28.67 | 77 | £27.54 | £27.34 |
| D | 365 | * | £23.18 | £23.29 | 182 | £22.67 | £23.29 |
| E | 369 | * | £18.44 | £18.81 | 164 | £18.81 | £19.27 |
| T | 0 | 0 | £0.00 | £0.00 | * | £0.00 | £0.00 |
| F | 141 | * | £0.00 | £14.67 | 83 | £15.03 | £15.20 |
| G | 68 | * | £29.35 | £12.65 | 46 | £12.54 | £12.65 |
| H | 3 | 0 | £0.00 | £0.00 | * | £10.89 | £10.86 |
| Total | 1210 | 20 | £20.37 | £19.27 | 589 | £21.15 | £19.27 |
Please note that * denotes a return of less than 10.
Table 37. Pay gap information for White other and Other staff.
| Pay Grade | Total No. Staff in Pay Grade | White Other No. Staff | White Other £ Mean Hourly | White Other £ Median Hourly | Other No. Staff | Other £ Mean Hourly | Other £ Median Hourly |
|---|---|---|---|---|---|---|---|
| Q, N & M | 10 | * | £45.19 | £45.19 | 0 | £0.00 | £0.00 |
| A | 20 | * | £39.96 | £39.96 | 0 | £0.00 | £0.00 |
| B | 44 | * | £32.80 | £32.28 | 0 | £0.00 | £0.00 |
| C | 190 | 15 | £27.34 | £28.00 | * | £27.34 | £27.34 |
| D | 365 | 29 | £22.64 | £23.29 | * | £22.76 | £23.29 |
| E | 369 | 38 | £18.54 | £18.81 | * | £19.27 | £19.27 |
| T | 0 | 0 | £0.00 | £0.00 | 0 | £0.00 | £0.00 |
| F | 141 | * | £15.04 | £15.20 | * | £14.61 | £14.49 |
| G | 68 | * | £12.65 | £12.65 | 0 | £0.00 | £0.00 |
| H | 3 | 0 | £0.00 | £0.00 | 0 | £0.00 | £0.00 |
| Total | 1210 | 99 | £21.49 | £19.27 | 10 | £19.73 | £19.27 |
Please note that * denotes a return of less than 10.
Table 38. Pay gap information for White British and Information not provided staff.
| Pay Grade | Total No. Staff in Pay Grade | White British No. Staff | White British £ Mean Hourly | White British £ Median Hourly | Information Not Provided No. Staff | Information Not Provided £ Mean Hourly | Information Not Provided £ Median Hourly |
|---|---|---|---|---|---|---|---|
| Q, N & M | 10 | * | £47.41 | £47.41 | * | £57.31 | £60.06 |
| A | 20 | * | £39.83 | £40.92 | * | £38.74 | £39.03 |
| B | 44 | 15 | £32.63 | £33.85 | * | £33.41 | £33.85 |
| C | 190 | 74 | £28.13 | £28.67 | 20 | £27.51 | £29.02 |
| D | 365 | 107 | £22.85 | £23.29 | 39 | £21.61 | £21.18 |
| E | 369 | 93 | £19.03 | £19.27 | 62 | £17.80 | £17.17 |
| T | 0 | 0 | £0.00 | £0.00 | 0 | £0.00 | £0.00 |
| F | 141 | 17 | £15.02 | £15.20 | 27 | £14.22 | £13.99 |
| G | 68 | 11 | £12.60 | £12.65 | * | £11.74 | £11.60 |
| H | 3 | 0 | £0.00 | £0.00 | 0 | £0.00 | £0.00 |
| Total | 1210 | 324 | £23.07 | £23.29 | 168 | £20.74 | £19.27 |
Please note that * denotes a return of less than 10.
Pay gap information for Black/Asian and White Scottish staff. The race group of Other has the lowest mean hourly salary at £19.73, which is a £3.34 (14.48%) gap compared to the highest mean hourly salary of £23.07 for White British group. The White British group also has the highest median hourly salary at £23.29, compared to all other ethnicity groups, which have a median hourly rate of £19.27. This is a gap of £4.02, or 17.26%.
The differences are due to the demographic spread and pay band split within the race groupings; there is no indication of any intended pay inequity for any race grouping. Less than 1% of staff have identified as being in the ‘Other’ category and this small proportion, along with the pay points they are on has resulted in the lower mean figure. Overall, as the table shows, the salary gap between the highest and lowest pay group has decreased over the period that we have been measuring this from 21.83% at 31 March 2017.
Disability
The number of our staff who have declared a disability is very low, and with over 12% not having provided any information, it can be difficult to make any meaningful conclusions from this data. The data identifies a pay gap of £2.15 (9.75%) between the lowest mean hourly rate, which is for staff who have not provided information and the highest, which covers staff who haves a disability. The median pay gap represents a difference of £3.53 (16.27%) between the group who have not provided information compared to those who have declared no disability.
Of the small number of staff who have declared a disability, a higher proportion of those are in the higher pay bands, when compared to the other groups, resulting in the disability declared group having the highest overall mean hourly pay. The majority of staff have not declared a disability and it is this which results in this group having the higher overall median pay.
A summary of this information is available in Appendix 2.
Occupational segregation
A full summary of information on SEPA’s occupational segregation in terms of gender, race and disability is available in Appendix 3.
Section 6: Our Equal Pay Policy
Our Equal Pay Policy is published on our website.
Appendix 1
Table 39. The mean and median gender pay gap for all employees as at 30 November 2022.
| Pay Grade | Total No. Staff in Pay Grade | No. Female Staff in Grade | Female £ Mean Hourly | Female £ Median Hourly | No. Male Staff in Grade | Male £ Mean Hourly | Male £ Median Hourly | Mean Pay Gap £ | Mean Pay Gap % | Mean Pay Gap £ | Median Pay Gap % |
|---|---|---|---|---|---|---|---|---|---|---|---|
| Q, M & N | 10 | * | £50.38 | £45.19 | * | £52.54 | £53.23 | £2.16 | 4.11% | £8.05 | 15.12% |
| A | 20 | * | £39.68 | £39.96 | 11 | £39.76 | £39.96 | £0.08 | 0.20% | £0.00 | 0.00% |
| B | 44 | 21 | £32.64 | £33.06 | 23 | £33.01 | £31.13 | £0.37 | 1.12% | -£1.93 | -6.19% |
| C | 190 | 87 | £27.66 | £28.00 | 103 | £27.83 | £28.67 | £0.16 | 0.59% | £0.67 | 2.34% |
| D | 365 | 205 | £22.57 | £23.29 | 160 | £22.67 | £23.29 | £0.10 | 0.42% | £0.00 | 0.00% |
| E | 369 | 216 | £18.59 | £19.27 | 153 | £18.77 | £19.27 | £0.18 | 0.98% | £0.00 | 0.00% |
| T | 0 | 0 | £0.00 | £0.00 | 0 | £0.00 | £0.00 | £0.00 | 0.00% | £0.00 | 0.00% |
| F | 141 | 98 | £14.90 | £15.20 | 43 | £14.78 | £15.20 | -£0.11 | -0.77% | £0.00 | 0.00% |
| G | 68 | 49 | £12.49 | £12.65 | 19 | £12.44 | £12.56 | -£0.04 | -0.36% | £0.00 | 0.00% |
| H | * | * | £10.86 | £10.86 | * | £10.86 | £10.86 | £0.00 | 0.00% | £0.00 | 0.00% |
| Total ex CLT | 1200 | 686 | £20.66 | £23.29 | 514 | £22.29 | £22.21 | £1.62 | 7.29% | -£1.08 | -4.86% |
| Total inc CLT | 1210 | 691 | £20.88 | £23.29 | 519 | £22.58 | £22.21 | £1.70 | 7.53% | -£1.08 | -4.86% |
Please note that * denotes a return of less than 10.
Appendix 2
Table 40. Pay gap information SEPA staff who have declared a disability.
| Pay Band | No of staff in pay band | No of staff with disability declared | £ Mean Basic Hourly | £ Median Basic Hourly | No of staff with no disability declared | £ Mean Basic Hourly | £ Median Basic Hourly | No of staff where disability declaration was not provided | £ Mean Basic Hourly | £ Median Basic Hourly |
|---|---|---|---|---|---|---|---|---|---|---|
| Q | 10 | * | £49.63 | £49.63 | * | £49.75 | £47.41 | * | £57.31 | £60.06 |
| A | 20 | 0 | £0.00 | £0.00 | 18 | £39.90 | £39.96 | * | £38.12 | £38.12 |
| B | 44 | 0 | £0.00 | £0.00 | 41 | £32.84 | £33.85 | * | £32.83 | £33.85 |
| C | 190 | * | £28.24 | £28.67 | 172 | £27.77 | £28.67 | 12 | £27.22 | £27.02 |
| D | 365 | * | £22.48 | £23.29 | 321 | £22.73 | £23.29 | 35 | £21.62 | £21.18 |
| E | 369 | 10 | £18.70 | £19.27 | 296 | £18.85 | £19.27 | 63 | £17.81 | £17.11 |
| T | 0 | 0 | £0.00 | £0.00 | 0 | £0.00 | £0.00 | 0 | £0.00 | £0.00 |
| F | 141 | * | £15.20 | £15.20 | 116 | £15.01 | £15.20 | 23 | £14.06 | £13.99 |
| G | 68 | * | £12.65 | £12.65 | 59 | £12.56 | £12.65 | * | £11.74 | £11.55 |
| H | 3 | * | £0.00 | £0.00 | £10.86 | £10.86 | 0 | £0.00 | £0.00 | |
| Total | 1210 | 29 | £22.14 | £20.69 | 1032 | £21.83 | £21.69 | 148 | £19.98 | £18.16 |
Please note that * denotes a return of less than 10.
Appendix 3
Occupational segregation
These are the definitions of our different pay grades. The pay grades are used in the following tables:
- Q, M &N - Member of Corporate Leadership Team
- A - Member of Senior Management Team
- B - Manager of managers or national experts with management responsibility
- C - Core unit manager or technical specialist
- D- Supervisory or senior technical role
- E - Core officer / technical role
- F- Support officer role
- G- Administrative role
- H- Building support role
- T - Trainee core officer role
Table 41. SEPA occupational segregation by gender as at 30 November 2022
| Management roles | Policy roles | Regulatory roles | Science roles | Business and support roles | Management roles | ||||||||
|---|---|---|---|---|---|---|---|---|---|---|---|---|---|
| Pay Grade | Number of Female | Number of Male | Number of Female | Number of Male | Number of Female | Number of Male | Number of Female | Number of Male | Number of Female | Number of Male | Number of Female | Number of Male | Number of Staff |
| Q, M & N | * | * | 0 | 0 | 0 | 0 | 0 | 0 | 0 | 0 | * | * | 10 |
| A | * | 11 | 0 | 0 | 0 | 0 | 0 | 0 | 0 | 0 | * | 11 | 20 |
| B | 21 | 23 | 0 | 0 | 0 | 0 | 0 | 0 | 0 | 0 | 21 | 23 | 44 |
| C | 43 | 44 | 13 | * | 10 | 30 | * | * | 14 | 12 | 87 | 103 | 190 |
| D | * | 0 | 22 | * | 69 | 74 | 65 | 55 | 45 | 23 | 205 | 160 | 365 |
| E | 0 | 0 | * | 0 | 81 | 61 | 88 | 68 | 40 | 24 | 216 | 153 | 369 |
| F | 0 | 0 | 0 | 0 | * | * | 43 | 34 | 52 | * | 98 | 43 | 141 |
| G | 0 | 0 | 0 | 0 | 0 | 0 | 0 | 0 | 49 | 19 | 49 | 19 | 68 |
| H | 0 | 0 | 0 | 0 | 0 | 0 | 0 | 0 | * | * | * | * | * |
| T | 0 | 0 | 0 | 0 | 0 | 0 | 0 | 0 | 0 | 0 | 0 | 0 | |
| Total | 82 | 83 | 42 | 16 | 163 | 166 | 203 | 166 | 201 | 88 | 691 | 519 | 1210 |
Table 42. SEPA occupational segregation by race as at 30 November 2022.
| Pay Grade | Race Declaration | Management Role Number of Staff | Policy Role Number of Staff | Regulatory Role Number of Staff | Science Role Number of Staff | Business & Support Role Number of Staff | Total Number of Staff |
|---|---|---|---|---|---|---|---|
| Q, N and M - Member of Corporate Leadership Team | Black / Asian | 0 | 0 | 0 | 0 | 0 | 0 |
| Q, N and M - Member of Corporate Leadership Team | Information Not Provided | * | 0 | 0 | 0 | 0 | * |
| Q, N and M - Member of Corporate Leadership Team | Other | 0 | 0 | 0 | 0 | 0 | 0 |
| 0Q, N and M - Member of Corporate Leadership Team | White - British | * | 0 | 0 | 0 | 0 | * |
| Q, N and M - Member of Corporate Leadership Team | White - Other | * | 0 | 0 | 0 | 0 | * |
| Q, N and M - Member of Corporate Leadership Team | White - Scottish | * | 0 | 0 | 0 | 0 | * |
| A - Member of Senior Management Team | Black / Asian | 0 | 0 | 0 | 0 | 0 | 0 |
| A - Member of Senior Management Team | Information Not Provided | * | 0 | 0 | 0 | 0 | * |
| A - Member of Senior Management Team | Other | 0 | 0 | 0 | 0 | 0 | 0 |
| A - Member of Senior Management Team | White - British | * | 0 | 0 | 0 | 0 | * |
| A - Member of Senior Management Team | White - Other | * | 0 | 0 | 0 | 0 | * |
| A - Member of Senior Management Team | White - Scottish | 11 | 0 | 0 | 0 | 0 | 11 |
| B - Manager of managers or national experts with management responsibility | Black / Asian | 0 | 0 | 0 | 0 | 0 | 0 |
| B - Manager of managers or national experts with management responsibility | Information Not Provided | * | 0 | 0 | 0 | 0 | * |
| B - Manager of managers or national experts with management responsibility | Other | 0 | 0 | 0 | 0 | 0 | 0 |
| B - Manager of managers or national experts with management responsibility | White - British | 15 | 0 | 0 | 0 | 0 | 15 |
| B - Manager of managers or national experts with management responsibility | White - Other | * | 0 | 0 | 0 | 0 | * |
| B - Manager of managers or national experts with management responsibility | White - Scottish | 19 | 0 | 0 | 0 | 0 | 19 |
| C - Core unit manager or technical specialist | Black / Asian | 0 | 0 | * | 0 | * | * |
| C - Core unit manager or technical specialist | Information Not Provided | 10 | * | * | 0 | * | 20 |
| C - Core unit manager or technical specialist | Other | * | 0 | 0 | 0 | 0 | * |
| C - Core unit manager or technical specialist | White - British | 29 | 16 | 13 | 10 | * | 74 |
| C - Core unit manager or technical specialist | White - Other | * | * | * | * | * | 15 |
| C - Core unit manager or technical specialist | White - Scottish | 42 | * | 17 | * | 13 | 77 |
| D - Supervisory or senior technical role | Black / Asian | 0 | * | 0 | * | * | * |
| D - Supervisory or senior technical role | Information Not Provided | 0 | * | 12 | 11 | 13 | 39 |
| D - Supervisory or senior technical role | Other | 0 | 0 | * | * | 0 | * |
| D - Supervisory or senior technical role | White - British | * | 10 | 52 | 35 | * | 107 |
| D - Supervisory or senior technical role | White - Other | 0 | * | * | 14 | * | 29 |
| D - Supervisory or senior technical role | White - Scottish | * | 12 | 69 | 55 | 45 | 182 |
| E - Core officer / technical role | Black / Asian | 0 | * | * | * | * | * |
| E - Core officer / technical role | Information Not Provided | 0 | 0 | 25 | 25 | 12 | 62 |
| E - Core officer / technical role | Other | 0 | 0 | * | * | 0 | * |
| E - Core officer / technical role | White - British | 0 | * | 32 | 48 | 12 | 93 |
| E - Core officer / technical role | White - Other | 0 | * | 13 | 16 | * | 38 |
| E - Core officer / technical role | White - Scottish | 0 | * | 67 | 63 | 31 | 164 |
| F - Support officer role | Black / Asian | 0 | 0 | 0 | * | 0 | * |
| F - Support officer role | Information Not Provided | 0 | 0 | * | 21 | * | 27 |
| F - Support officer role | Other | 0 | 0 | 0 | * | * | * |
| F - Support officer role | White - British | 0 | 0 | 0 | 10 | * | 17 |
| F - Support officer role | White - Other | 0 | 0 | 0 | * | * | * |
| F - Support officer role | White - Scottish | 0 | 0 | * | 38 | 44 | 83 |
| G - Administrative role | Black / Asian | 0 | 0 | 0 | 0 | * | * |
| G - Administrative role | Information Not Provided | 0 | 0 | 0 | 0 | * | * |
| G - Administrative role | Other | 0 | 0 | 0 | 0 | 0 | 0 |
| G - Administrative role | White - British | 0 | 0 | 0 | 0 | 11 | 11 |
| G - Administrative role | White - Other | 0 | 0 | 0 | 0 | * | * |
| G - Administrative role | White - Scottish | 0 | 0 | 0 | 0 | 46 | 46 |
| H- Building support role | Black / Asian | 0 | 0 | 0 | 0 | 0 | 0 |
| H- Building support role | Information Not Provided | 0 | 0 | 0 | 0 | 0 | 0 |
| H- Building support role | Other | 0 | 0 | 0 | 0 | 0 | 0 |
| H- Building support role | White - British | 0 | 0 | 0 | 0 | 0 | 0 |
| H- Building support role | White - Other | 0 | 0 | 0 | 0 | 0 | 0 |
| H- Building support role | White - Scottish | 0 | 0 | 0 | 0 | * | * |
| T - Trainee core officer role | Black / Asian | 0 | 0 | 0 | 0 | 0 | 0 |
| T - Trainee core officer role | Information Not Provided | 0 | 0 | 0 | 0 | 0 | 0 |
| T - Trainee core officer role | Other | 0 | 0 | 0 | 0 | 0 | 0 |
| T - Trainee core officer role | White - British | 0 | 0 | 0 | 0 | 0 | 0 |
| T - Trainee core officer role | White - Other | 0 | 0 | 0 | 0 | 0 | 0 |
| T - Trainee core officer role | White - Scottish | 0 | 0 | 0 | 0 | 0 | 0 |
| Sub Totals | Black / Asian | 0 | * | * | * | * | 20 |
| Sub Totals | Information Not Provided | 23 | * | 48 | 57 | 36 | 168 |
| Sub Totals | Other | * | 0 | * | * | * | 10 |
| Sub Totals | White - British | 54 | 27 | 97 | 103 | 43 | 324 |
| Sub Totals | White - Other | 10 | * | 23 | 36 | 21 | 99 |
| Sub Totals | White - Scottish | 77 | 16 | 154 | 160 | 182 | 589 |
| Grand Total | 165 | 85 | 329 | 369 | 289 | 1210 |
Please note that * denotes a return of less than 10.
Table 43. SEPA occupation segregation by disability as at 30 November 2022.
| Pay Grade | Disability Declaration | Management Role Number of Staff | Policy Role Number of Staff | Regulatory Role Number of Staff | Science Role Number of Staff | Business & Support Role Number of Staff | Total Number of Staff |
|---|---|---|---|---|---|---|---|
| Q, N and M - Member of Corporate Leadership Team | Information Not Provided | * | 0 | 0 | 0 | 0 | * |
| Q, N and M - Member of Corporate Leadership Team | No Disability Declared | * | 0 | 0 | 0 | 0 | * |
| Q, N and M - Member of Corporate Leadership Team | Disability Declared | * | 0 | 0 | 0 | 0 | * |
| A - Member of Senior Management Team | Information Not Provided | * | 0 | 0 | 0 | 0 | * |
| A - Member of Senior Management Team | No | 18 | 0 | 0 | 0 | 0 | 18 |
| A - Member of Senior Management Team | Yes | 0 | 0 | 0 | 0 | 0 | 0 |
| B - Manager of managers or national experts with management responsibility | Information Not Provided | * | 0 | 0 | 0 | 0 | * |
| B - Manager of managers or national experts with management responsibility | No | 41 | 0 | 0 | 0 | 0 | 41 |
| B - Manager of managers or national experts with management responsibility | Yes | 0 | 0 | 0 | 0 | 0 | 0 |
| C - Core unit manager or technical specialist | Information Not Provided | * | * | * | 0 | * | * |
| C - Core unit manager or technical specialist | No | 79 | 20 | 35 | 15 | 23 | 172 |
| C - Core unit manager or technical specialist | Yes | * | 0 | * | * | * | * |
| D - Supervisory or senior technical role | Information Not Provided | 0 | * | * | 11 | 14 | 35 |
| D - Supervisory or senior technical role | No | 0 | * | * | * | 0 | * |
| D - Supervisory or senior technical role | Yes | * | 26 | 129 | 108 | 54 | 321 |
| E - Core officer / technical role | Information Not Provided | 0 | 0 | 25 | 25 | 13 | 63 |
| E - Core officer / technical role | No | 0 | * | 114 | 126 | 49 | 296 |
| E - Core officer / technical role | Yes | 0 | 0 | * | * | * | 10 |
| F - Support officer role | Information Not Provided | 0 | 0 | * | 19 | * | 23 |
| F - Support officer role | No | 0 | 0 | * | 58 | 57 | 116 |
| F - Support officer role | Yes | 0 | 0 | 0 | 0 | * | * |
| G - Administrative role | Information Not Provided | 0 | 0 | 0 | 0 | * | * |
| G - Administrative role | No | 0 | 0 | 0 | 0 | 59 | 59 |
| G - Administrative role | Yes | 0 | 0 | 0 | 0 | * | * |
| H- Building support role | Information Not Provided | 0 | 0 | 0 | 0 | 0 | 0 |
| H- Building support role | No | 0 | 0 | 0 | 0 | 3 | 3 |
| H- Building support role | Yes | 0 | 0 | 0 | 0 | 0 | 0 |
| T - Trainee core officer role | Information Not Provided | 0 | 0 | 0 | 0 | 0 | 0 |
| T - Trainee core officer role | No | 0 | 0 | 0 | 0 | 0 | 0 |
| T - Trainee core officer role | Yes | 0 | 0 | 0 | 0 | 0 | 0 |
| Sub totals | Sub totals | Sub totals | Sub totals | 41 | 55 | 36 | 148 |
| Sub totals | No | 148 | 53 | 279 | 307 | 245 | 1032 |
| Sub totals | Yes | * | * | * | * | * | 30 |
| Grand totals | 165 | 58 | 329 | 369 | 289 | 1210 |
Please note that * denotes a return of less than 10.