Industrial greenhouse gas emissions data reflects dynamics of Scotland’s energy sector
Date published: 01 October 2024
This is a policy statement and relates to the 2023 pollutant emissions and waste transfers from SEPA-regulated industrial sites Official Statistics published at 9.30am on Tuesday 01 October 2024 and available on SEPA's website.
- The global warming potential of greenhouse gas emissions at SEPA regulated sites was down 13.5% between 2022 and 2023
- Reduced production in 2023 at two major sites in the energy sector was one of the main reasons for this decrease
- Greenhouse gas emissions continue to follow a long-term downward trend overall
The Scottish Environment Protection Agency (SEPA) has published its Scottish Pollutant Release Inventory (SPRI) data for 2023.
The statistics show the global warming potential of greenhouse gas emissions, measured in carbon dioxide equivalent (CO2e) went down by 13.5%, 1.51 megatonnes (Mt) CO2e, between 2022 and 2023.
Information reported by some operators indicated that changes in production for the major emitters in 2023 have contributed to a decrease in emissions therefore it would not be appropriate to draw conclusions from the decrease seen in 2023 with regards to long-term trends.
SPRI provides a valuable picture of the amounts of pollutants released in Scotland from SEPA-regulated industrial sites. It is a publicly accessible electronic database and aims to provide information for policy makers, academics and the public about the pressure Scottish industry puts on the environment through greenhouse gas and other emissions.
SPRI does not assess or state the compliance of the facilities or the health and environmental impact of the releases.
Carbon dioxide emissions, which dominate the greenhouse gas trend, were down 13.5% (1.41 Mt) between 2022 in 2023. They were 20% (2.29 Mt) lower than 2019.
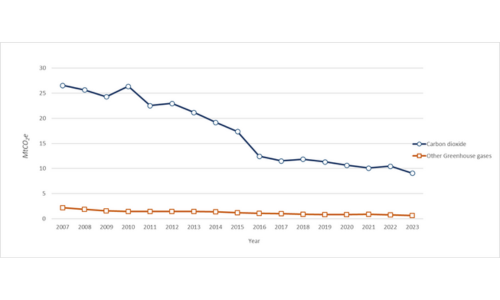
Figure 1: Global warming potential of greenhouse gases reported to SPRI since 2007 (MtCO2e)
The energy sector remains the highest emitter in Scotland’s industrial data inventory, accounting for 40.0% of the overall greenhouse gas emissions. The sector reported a 22.9% decrease in greenhouse gas emissions in 2023 due to changes to production outputs and was responsible for 42.0% of overall CO2 emissions, 13.2% of methane, 69.5% of Nitrous oxide and 9.9% of Hydrofluorocarbons.
The largest changes in greenhouse gas emissions were at the Peterhead Power Station, operated by Scottish and Southern Energy, with a 54.3% decrease and at the Grangemouth Refinery site, operated by Petroineos Manufacturing Scotland Limited, with a 27.6% decrease. The changes at these sites reflected site-specific production requirements and site outages and represent 68% of the overall decrease in Scotland’s greenhouse gas emissions between 2022 and 2023.
Peterhead Power Station, a gas-fired thermal facility, is now the only large-scale thermal power station generating electricity in Scotland and is designed to respond quickly to market changes, maintaining security of electricity supply. Data from the UK Department of Energy Security and Net Zero indicates that during 2023, electricity generated in the UK from wind and solar sources increased to the highest level to date whilst the UK’s net import dependency also increased to its highest level since 2014.
Notes to editor
SPRI
The full 2023 SPRI data set can be accessed on SEPA’s website. Data for 2007 onwards are available in SEPA’s SPRI tool on Scotland’s environment web.
Using the tool to compare facilities or sectors provides a general overview of the total amounts of pollutants released or waste transferred. However, direct and causal inferences should not be made because detailed knowledge of processes, installed abatement technologies and other installed emission reduction technologies and practices must be known before this type of analyses can be accurately and definitively performed. Further, the types and amounts of source material, management methods, production patterns, etc. must also be known.
Carbon dioxide equivalent
The reduction in emissions in this media release are reported in terms of carbon dioxide equivalent (CO2e) to reflect the global warming potential (GWP) of greenhouse gases. The figures reported in the SPRI dataset are total emissions in kilograms.
SEPA has estimated global warming potential using data on the six main greenhouse gases (GHG) reported to SPRI. Carbon Dioxide (CO2) is the most prevalent, accounting for 93% of GHG emissions.
Each GHG absorbs different levels of energy so has different effects on the earth’s warming. The Global Warming Potential (GWP) enables comparisons between the global warming impacts of different GHGs. This is known as the carbon dioxide equivalent (CO2e).
In November 2021, during the Conference of the Parties (COP26) of the United Nations Framework Convention on Climate Change (UNFCCC), the global community agreed that greenhouse gas emissions reporting, under the Paris Agreement transparency framework, should use the 100-year GWPs that are specified in the IPCC’s Fifth Assessment Report (AR5). For this reason, the GPW values used in this year's publication are based on the AR5 GWPs, aligning with the approach used in the Scottish Greenhouse Gas Statistics for 2022.
SEPA now reports the global warming potential (GWP) of greenhouse gases reported to SPRI since 2017. Our calculations show that the downward trend in GWP is levelling off and that carbon dioxide continues to dominate.
Table 1: Global warming potential in carbon dioxide equivalent (kgCO2e)
| Year | Carbon dioxide | Methane | Nitrous oxide | Hydrofluoro-carbons (HFCs)* | Perfluoro-carbons (PFCs)* | Sulphur hexafluoride | Total greenhouse gases |
|---|---|---|---|---|---|---|---|
| 2007 | 26,549,962,882 | 1,981,693,028 | 78,517,115 | 20,100,400 | 81,351,900 | 13,491,350 | 28,725,116,675 |
| 2008 | 25,676,478,179 | 1,591,198,980 | 83,953,590 | 21,985,200 | 133,100,100 | 24,205,000 | 27,530,921,049 |
| 2009 | 24,293,673,096 | 1,437,277,912 | 56,163,570 | 10,416,000 | 48,753,420 | 4,418,000 | 25,850,701,998 |
| 2010 | 26,384,456,678 | 1,341,548,376 | 66,491,680 | 18,166,000 | 17,802,180 | 4,864,500 | 27,833,329,414 |
| 2011 | 22,544,490,949 | 1,348,492,656 | 49,138,685 | 26,598,000 | 31,754,880 | 6,674,000 | 24,007,149,170 |
| 2012 | 22,984,923,683 | 1,341,906,104 | 51,703,885 | 32,686,400 | 34,299,000 | 7,144,000 | 24,452,663,072 |
| 2013 | 21,166,495,017 | 1,319,074,456 | 42,725,950 | 46,872,000 | 47,583,480 | 5,663,500 | 22,628,414,403 |
| 2014 | 19,204,496,971 | 1,195,764,752 | 45,438,755 | 22,840,800 | 93,721,740 | 4,173,600 | 20,566,436,618 |
| 2015 | 17,368,829,321 | 1,067,746,932 | 42,544,160 | 30,863,600 | 45,847,440 | 1,814,200 | 18,557,645,653 |
| 2016 | 12,460,891,832 | 978,884,704 | 34,753,160 | 21,501,600 | 50,065,440 | 2,998,600 | 13,549,095,336 |
| 2017 | 11,529,114,447 | 911,114,792 | 25,485,050 | 12,995,200 | 48,344,940 | 3,146,650 | 12,530,201,079 |
| 2018 | 11,849,079,760 | 779,698,304 | 23,809,190 | 43,561,200 | 49,039,800 | 2,516,850 | 12,747,705,104 |
| 2019 | 11,344,380,323 | 748,574,820 | 25,583,895 | 15,661,200 | 43,789,500 | 5,181,750 | 12,183,171,488 |
| 2020 | 10,644,634,306 | 727,221,628 | 19,489,690 | 45,086,400 | 44,489,910 | 5,329,800 | 11,486,251,734 |
| 2021 | 10,101,313,827 | 689,752,280 | 11,647,280 | 94,810,400 | 51,028,920 | 5,212,300 | 10,953,765,007 |
| 2022 | 10,467,066,942 | 650,547,604 | 13,137,375 | 18,215,600 | 50,660,400 | 5,400,300 | 11,204,968,221 |
| 2023 | 9,058,998,449 | 551,893,412 | 9,119,975 | 12,722,400 | 56,965,200 | 3,440,400 | 9,693,139,836 |
*It is not currently possible to reliably convert these parameters to carbon dioxide equivalent (CO2e) values as we do not formally collect information identifying individual species of hydrofluorocarbons and perfluorocarbons, however a best estimate has been provided making a number of assumptions.
In the SPRI dataset online, the total greenhouse gas emissions are reported in kg as follows:
Table 2: Total greenhouse gas emissions reported in SPRI (kg)*
| GHG (kg) | 2018 | 2019 | 2020 | 2021 | 2022 | 2023 |
|---|---|---|---|---|---|---|
| Carbon dioxide | 11,849,079,760 | 11,344,380,323 | 10,644,634,306 | 10,101,313,827 | 10,467,006,942 | 9,058,998,449 |
| Methane | 27,846,368 | 26,734,815 | 25,972,201 | 24,634,010 | 23,233,843 | 19,710,479 |
| Nitrous oxide | 89,846 | 96,543 | 73,546 | 43,952 | 49,575 | 34,415 |
| Hydrofluorocarbons (HFCs) | 3,513 | 1,263 | 3,636 | 7,646 | 1,469 | 1,026 |
| Perfluorocarbons (PFCs) | 4,418 | 3,945 | 4,008 | 4,597 | 4,564 | 5,132 |
| Sulphur hexafluoride | 107 | 221 | 227 | 222 | 230 | 146 |
| Total GHGs | 11,877,024,012 | 11,371,217,110 | 10,670,687,924 | 10,126,004,254 | 10,490,296,623 | 9,078,749,647 |
* values given are based on raw figures; table gives rounded totals
Digest of UK Energy Statistics
Data from the Digest of UK Energy Statistics is produced by the Department of Energy Security and Net Zero.
Net imports of energy at 69.5 mtoe (millions of tonnes of oil equivalent) were 6.8 per cent higher than in 2022 and accounted for 40.8 per cent of consumption in 2023, up from 37.0 per cent in 2022 and at the highest share level since 2014.
Wind sources generated 82.3 TWh of electricity in 2023 whilst solar photovoltaics generated 13.9 TWh, representing 28.1% and 4.7% respectively share of total electricity generation, the highest levels to date.